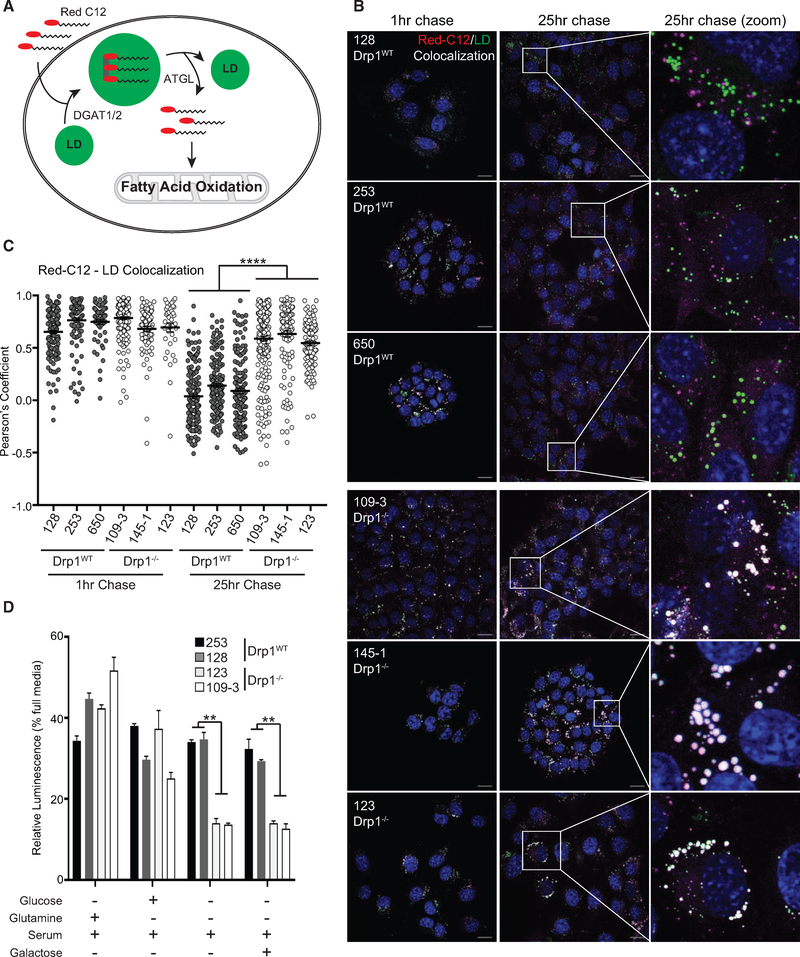
Figure 7. Drp1−/− Tumor Cells Exhibit Impaired Fatty Acid Trafficking.
(A) Schematic of Red C12 cellular processing.
(B) Representative confocal fluorescence images of Red C12 pulse-chase over 25 h in indicated cell lines. Red C12 (fatty acids, magenta), BODIPY 493/503 (lipid droplets, green), and DAPI (nuclei, blue). Scale bars, 20 μm.
(C) Quantification using Pearson’s correlation coefficient from (B) and Figure S5. (n = 3 [128 and 109–3 lines]; n = 2 [remaining cell lines], ≥50 cells analyzed per time point per cell line).
(D) Cell expansion of indicated cell lines under specified nutrient conditions following 24 h in culture (representative result, n = 3).

