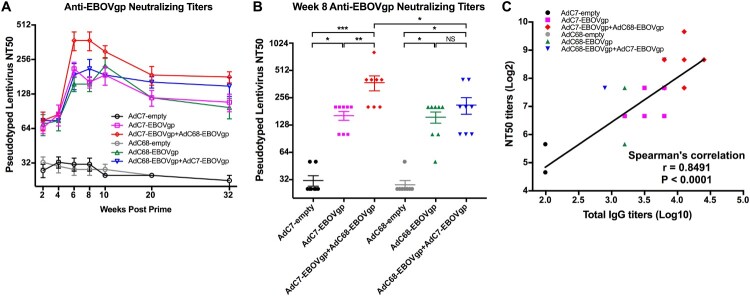
Figure 2.
Neutralizing antibody responses in immunized mice. (A) Kinetics of EBOV GP specific neutralizing antibody responses NT50 in 32 weeks post vaccination. (B) NT50 responses of each immunized groups at week 8 post vaccination. (C) Correlation between NT50 titres and total IgG titres. Pearson’s correlation was applied in this analysis. All data were displayed as mean ± SEM. Significant differences were displayed as: NS, no significant differences;
*P < 0.05; **P < 0.01; ***P < 0.001.

