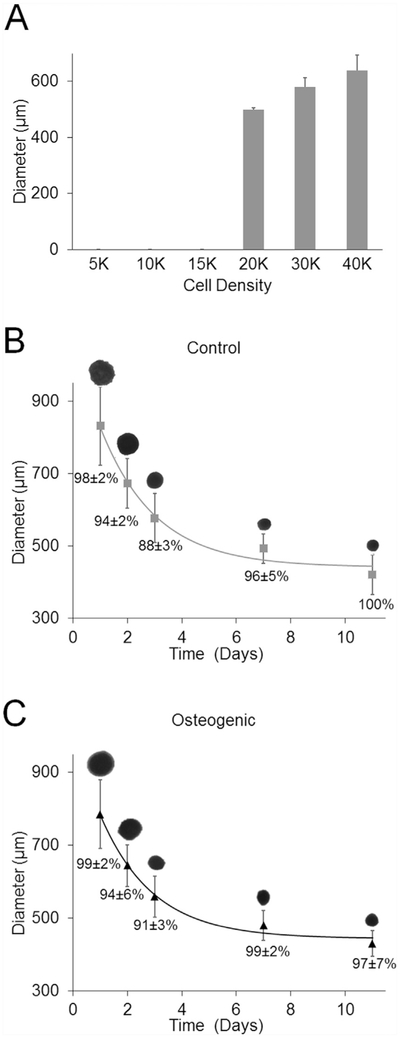
Fig. 2. Spheroid Diameter.
Diameter of gravity-induced spheroids (a) in control medium at different numbers per well on day 3 (n = 3). Representative silhouettes of gravity-induced spheroids with Regenova scanner for both (b) control and (c) osteogenic media. Parameters of the exponential decay equation (3) were fit to the average spheroid diameter data. Percent cell viability for both control and osteogenic spheroids is shown below diameter curve fit (n = 4).

