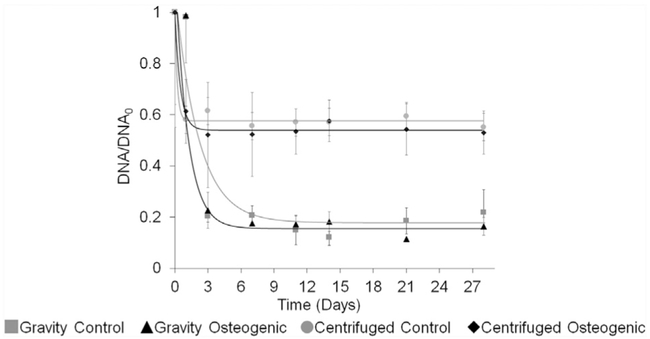
Fig. 5. DNA Content.

DNA content over time for both gravity-and centrifugation induced spheroids.  Gravity control spheroids. ▲ Gravity osteogenic spheroids.
  Centrifuged control spheroids. ◆ Centrifuged osteogenic spheroids. Four spheroids were collected per replicate (n = 3). Data were normalized to day 0. The parameters of the exponential decay equation (4) were fit to the DNA kinetic profile.
