Figure 3.
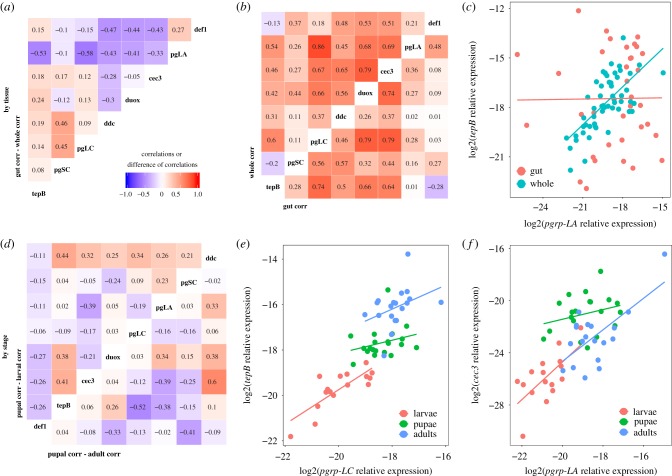
Gene expression correlations suggest partial decoupling of immune genes between tissues and among life stages. The pairwise Pearson correlation values of whole-body gene expression were subtracted from those of gut-only pairwise correlations to get the difference in correlation strength (a). Large positive values indicate a stronger relationship in the gut, while large negative values indicate stronger correlations in the whole body. The underlying correlations are visualized in (b) for whole body (top left) or gut only (bottom right); colours and numbers indicate the Pearson correlation coefficient. The breakdown of the correlation of pgrp-LA and tepB expression (log2 scale, relative to reference gene) in the gut relative to the whole body (c) illustrates decoupling among tissues. There was also decoupling by life stage, as illustrated by the relative magnitudes of the correlation coefficients for pupae against larvae (d, top left) and pupae against adults (d, bottom right). Stage-specific pairwise comparisons of pgrp-LC versus tepB expression (e) and pgrp-LA versus cecropin-3 expression (f) illustrate different examples of differences in coefficients among stages. (Online version in colour.)

