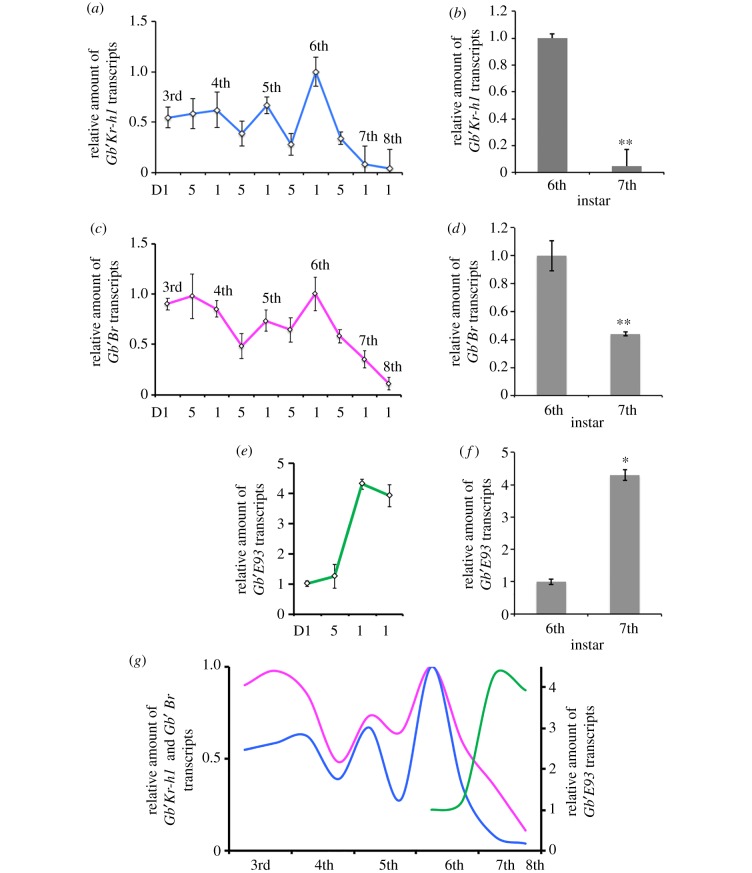
Figure 3.
Expression profiles of Gb′Kr-h1 Gb′Br and Gb′E93 transcripts in G. bimaculatus during development. (a,c,e) Temporal expression of Gb′Kr-h1 (a), Gb′Br (c), and Gb′E93 (e) in the abdomen tissues of nymphs based on qPCR analyses. Relative fold changes in mRNA levels were plotted, and the average expression levels on day 1 of the sixth instar were set at 1. mRNA levels were normalized to Gb′β-actin mRNA levels. Developmental stages are defined as days (D) after moulting. Data are presented as the mean ± s.d. (b,d,f) Transcript levels of Gb′Kr-h1 (b), Gb′Br (d) and Gb′E93 (f) were determined on day 1 of the sixth and seventh instars. The transcript levels determined on day 1 of the sixth instar control nymphs were set to 1. The data presented are the mean ± s.d. *p < 0.05; **p < 0.005 according to Student's t-test. (g) Comparison between expression levels of Gb′Kr-h1, Gb′Br and Gb′E93 during the development of nymphs. Units in the ordinates reflect the relative mRNA levels at each moment. Each value measured in individuals on day 1 of the sixth instar were set to 1. The blue, magenta and green curved lines represent the Gb′Kr-h1, Gb′Br and Gb′E93 mRNA levels, respectively.

