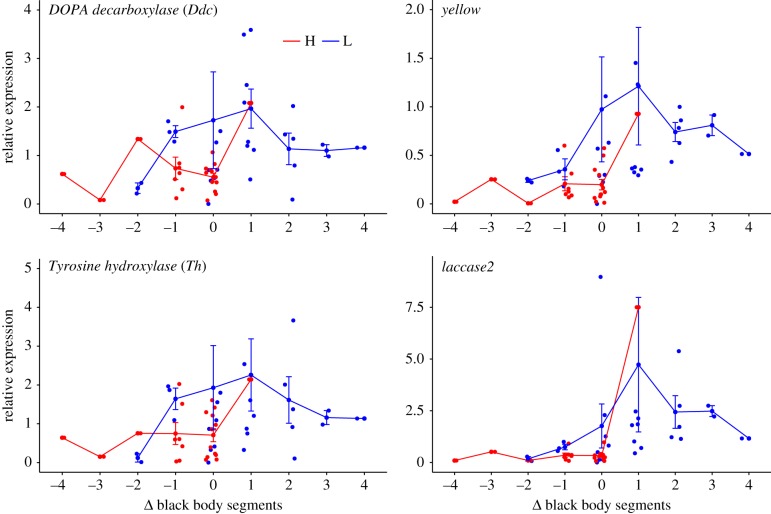
Figure 4.
Expression patterns (y-axis) of melanin candidate genes in wood tiger moth (Arctia plantaginis) larvae after a moult in which the number of black body segments (x-axis) increased (positive numbers), decreased (negative numbers) or remained the same (zero) after the previous moult. High (H, red) and low (L, blue) temperature treatments. (Online version in colour.)

