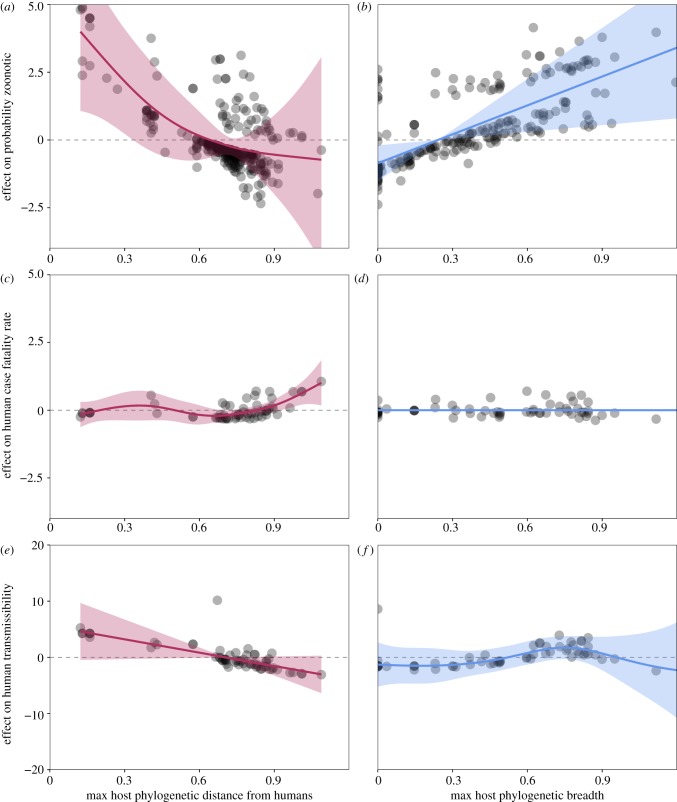
Figure 5.
Viral predictors of zoonotic risk. Partial effect plots from our selected GAMs show the relative effect of maximum host phylogenetic distance from humans (red) and host phylogenetic breadth (blue) on (a,b) the probability that a virus is zoonotic; (c,d) human CFR (virulence); and (e,f) capacity for human-to-human transmission (human transmissibility). Data points represent partial residuals, and shaded regions represent 95% confidence intervals by standard error around mean partial effects. Full model descriptions are provided in the electronic supplementary material, Data and Results, table S5e–g.

