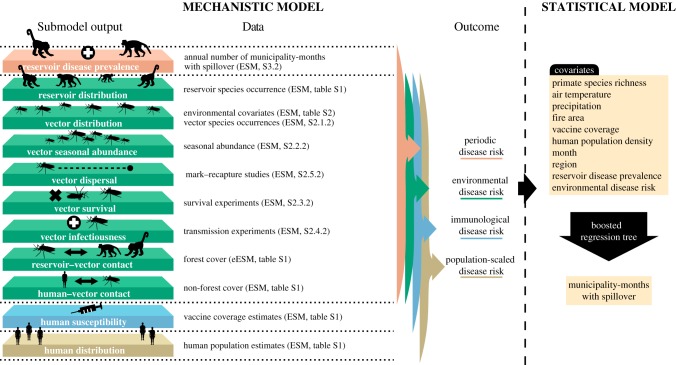
Figure 1.
Mechanistic and statistical model schematic. Submodels of components in the mechanistic model are parameterized using independent data on reservoir species, vector species occurrences, seasonal abundances, vector mark–recapture studies, vector survival, transmission experiments, forest cover, estimated vaccine coverage and human population estimates. Reservoir disease prevalence is estimated from annual number of municipality-months with spillover. The output from the submodels are used in a mechanistic spillover model to predict four risk metrics of yellow fever in humans: periodic disease risk, environmental disease risk, immunological disease risk, and population-scaled disease risk. Environmental disease risk metric is then used as a covariate in a boosted regression tree to predict the municipality-months with spillover and identify covariates important for predicting spillover. Other environmental covariates are also included in the boosted regression tree. Details on data used in the mechanistic model can be found in the electronic supplementary material (ESM). Specific locations within the electronic supplementary material are noted parenthetically by either the section or table in which details can be found. Data used in the boosted regression tree are described in electronic supplementary material, table S6. Layers shown on the left correspond to mechanistic model components in figure 2a–k.

