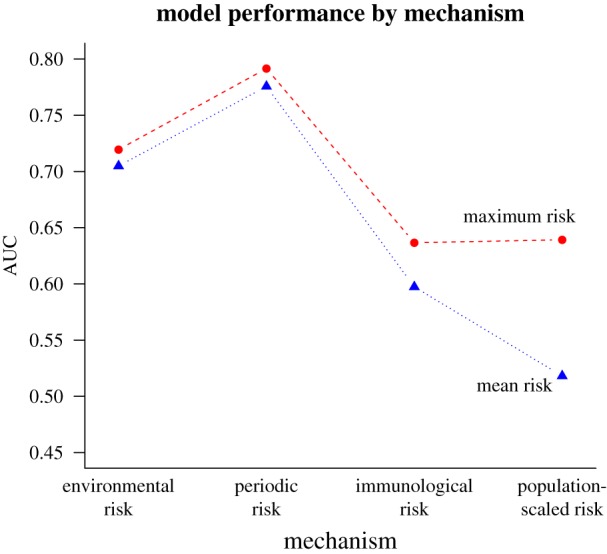
Figure 3.

Municipality maximum periodic risk best predicts spillover. Each point is the calculated area under the curve (AUC) from spillover predicted by modelled risk, where higher AUC represents a model better able to distinguish between spillover and non-spillover observations. The risk models (from left to right on the x-axis) are environmental risk, periodic risk, immunological risk and population-scaled risk. Municipality-wide maxima (red dashed lines and circles) and means (blue dotted lines and triangles) are shown for each metric.
