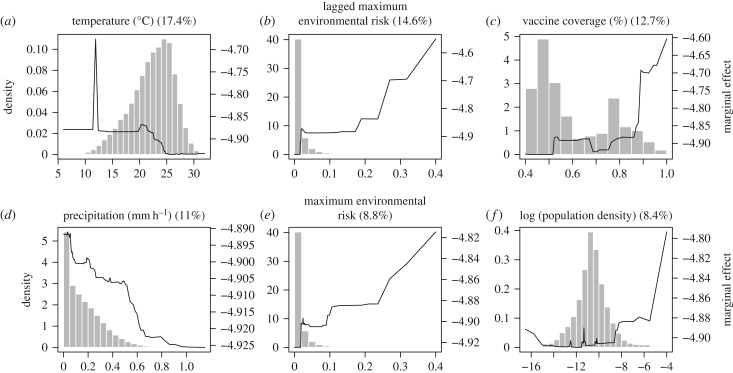
Figure 5.
Partial dependence plots of top six predictors of spillover in a municipality-month from boosted regression tree analysis. Plots are listed in order of predictive importance with relative influence (%) listed. In order, the variables identified as most important predictors were average temperature in the municipality-month (a), one-month lagged maximum environmental risk (b), estimated vaccine coverage (c), average rate of precipitation in the municipality-month (d), current month maximum environmental risk (e) and municipality population density (log-scaled for visibility, f). Histograms show the distribution of observed municipality-months at each covariate value (left y-axis) and solid lines show the marginal effects of covariate on model prediction (right y-axis). Marginal effects highlight the characteristics of municipality-months that experienced spillover in Brazil 2001–2016.

