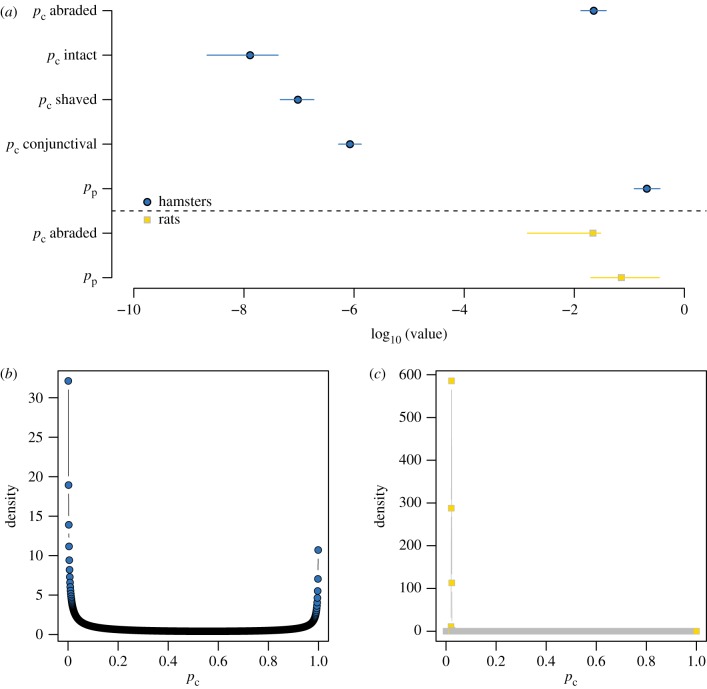
Figure 2.
Fitted parameter values. (a) Maximum-likelihood point estimates from the basic model of pp and pc, with 95% profile confidence intervals. The left-hand side of the x-axis represents probabilities closest to 0 (strongest immune barriers). (b) The mixture model returned a fitted distribution of pc values, instead of a single point estimate. The distribution fitted to data from hamsters was strongly bimodal. (c) The distribution of pc values fitted to data from rats asymptotically approached a Dirac delta function with all density at pc = 0.02, corresponding to the estimate from the basic model (electronic supplementary material, text). (Online version in colour.)

