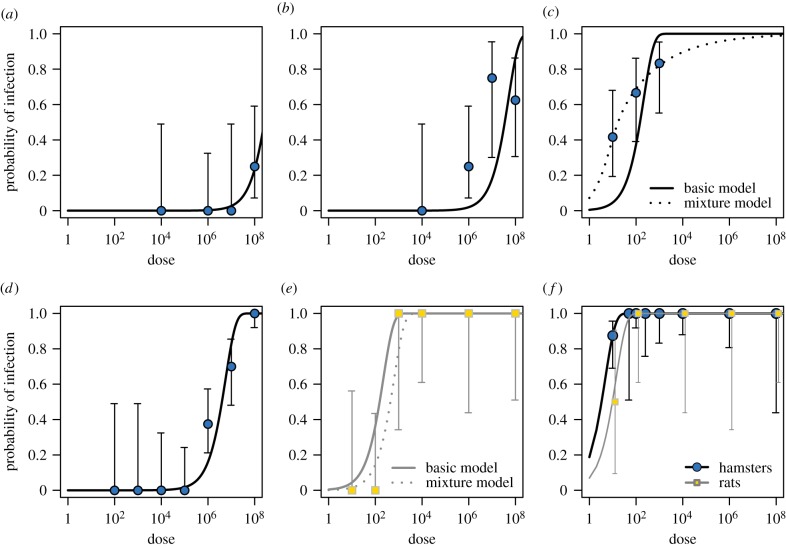
Figure 3.
Model fits to data. Curves represent model-predicted probabilities of infection for each route of inoculation by dose, based on maximum-likelihood estimates. Routes of inoculation and study species: (a) hamsters, intact skin, (b) hamsters, shaved skin, (c) hamsters, abraded skin, (d) hamsters, conjunctiva, (e) rats, abraded skin, (f) both species, IP inoculation. Points and vertical bars represent experimentally observed infection frequencies, and 95% binomial confidence intervals calculated using the Wilson method. (Online version in colour.)

