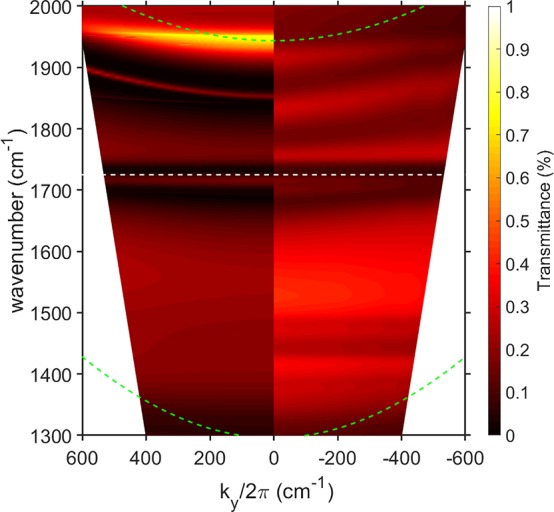
Figure 5.

Dispersion for ϕ = 90°. On the left-hand side are numerically calculated transmittance data for TM-polarized light; on the right-hand side are experimentally measured data. Again, both show coupling between the vibrational resonance and the plasmonic mode. The maximum polar angle for these data is 18°. The period of the grating is 4.5 μm with a 1 μm gap between metal stripes. The PMMA thickness is 1.5 μm and β = 1°. The green dashed lines represent the ±2 and ±3 scattered Si light-lines; the white dashed line indicates the position of the C=O resonance. As for Figure 4, the calculated data have been scaled by a factor of 0.1 to allow easy comparison with the experimental data.
