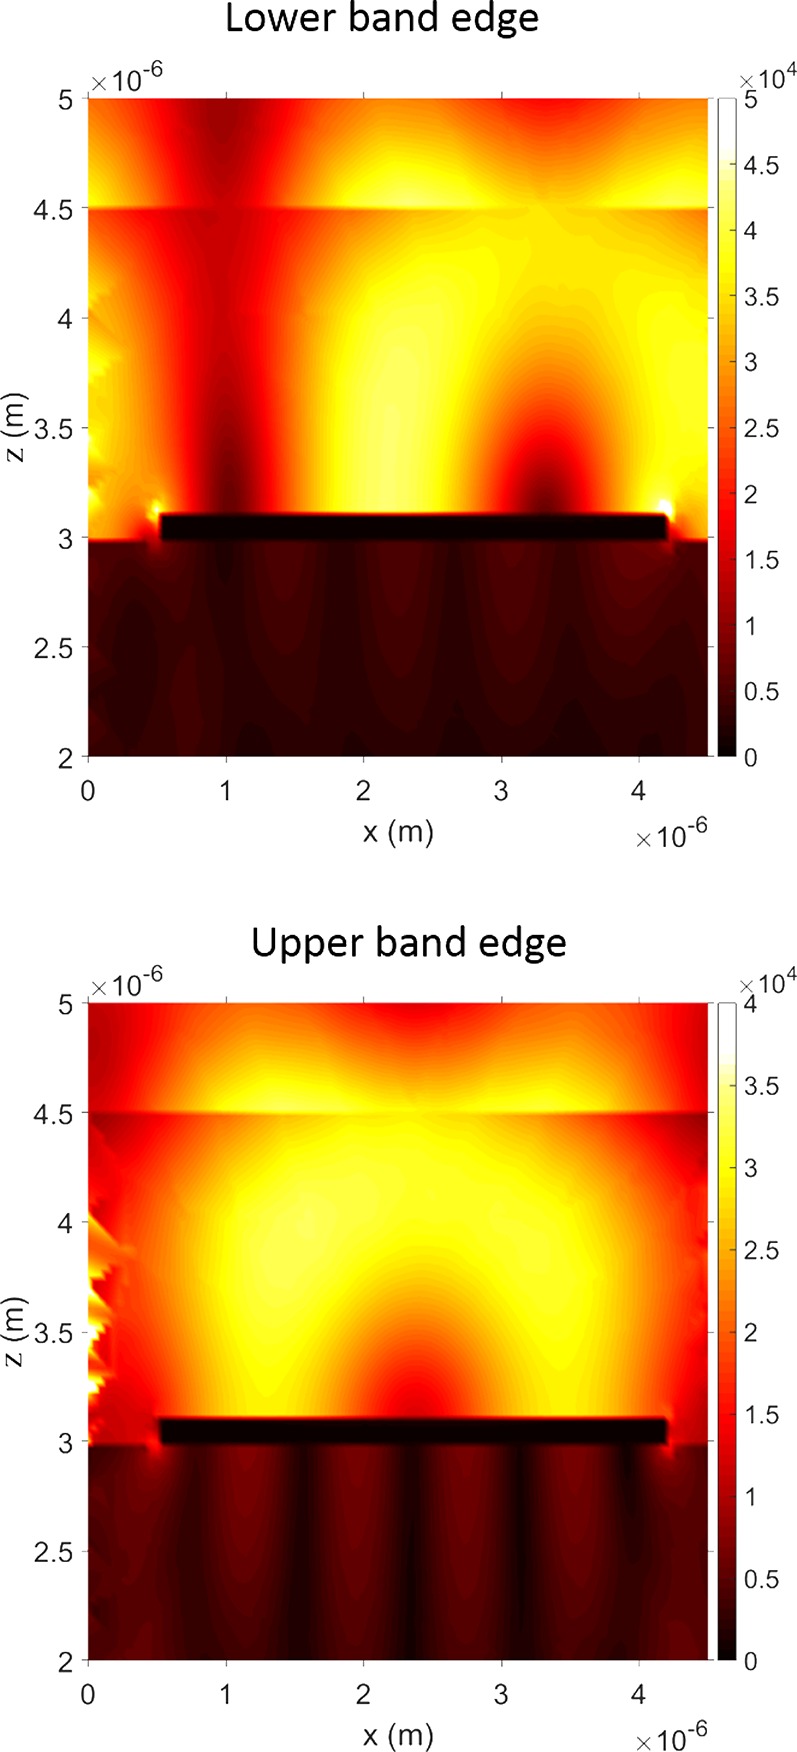
Figure 8.

Electric field distributions. Calculated normalized electric field distributions for light incident at θ = 1° and ϕ = 0° for the lower band edge (1817 cm–1) and the upper band edge (1847 cm–1). The plotted values are the magnitude (norm) of the electric field, relative to the incident field (these enhancements are higher than one would expect in the visible owing to the higher Q of these IR resonances). The discontinuity in the fields for z = 4.5 μm is due to the boundary between the PMMA and the air. Here β = 0°.
