
FIGURE 1:
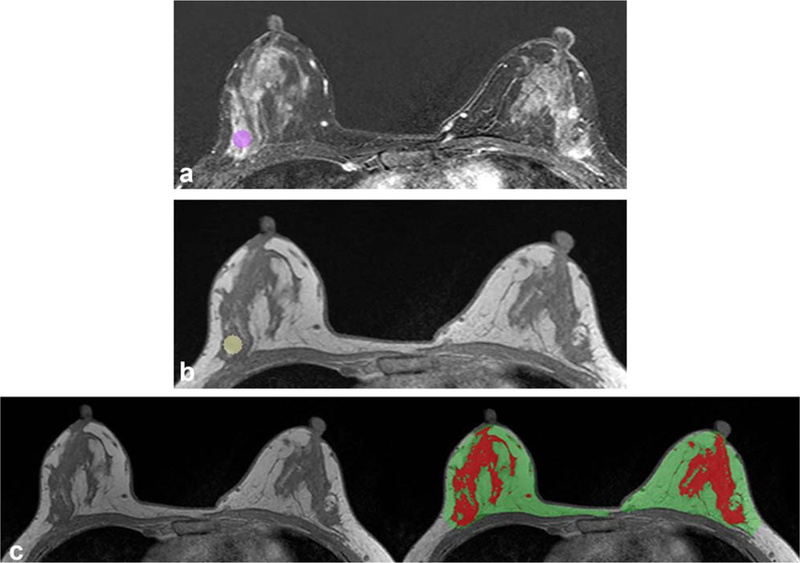
Example of quantitative assessment of background parenchymal enhancement using ROI and computer-based fibro-glandular tissue segmentation in a 39-year-old woman with invasive ductal carcinoma in the left breast. Circular ROI was placed at the area of the right breast that showed the strongest enhancement, which is shown on axial early subtraction MR image (A) and axial T1-weighted precontrast MR image without fat suppression (B). In every study examination, three ROIs were placed, and the respective average values were used for analysis. For calculation of late enhancement, a fully automatic segmentation of the contralateral breast fibroglandular tissue was also performed (C). T1-weighted precontrast MRI without fat suppression is shown without (left) and with (right) the breast parenchymal mask (area in green and red) and fibroglandular tissue segmentation (area in red). Subsequently, late enhancement was calculated for every voxel location in the fibroglandular tissue of the contralateral breast and the mean of the top 10% (LE90+) was used for further analysis.