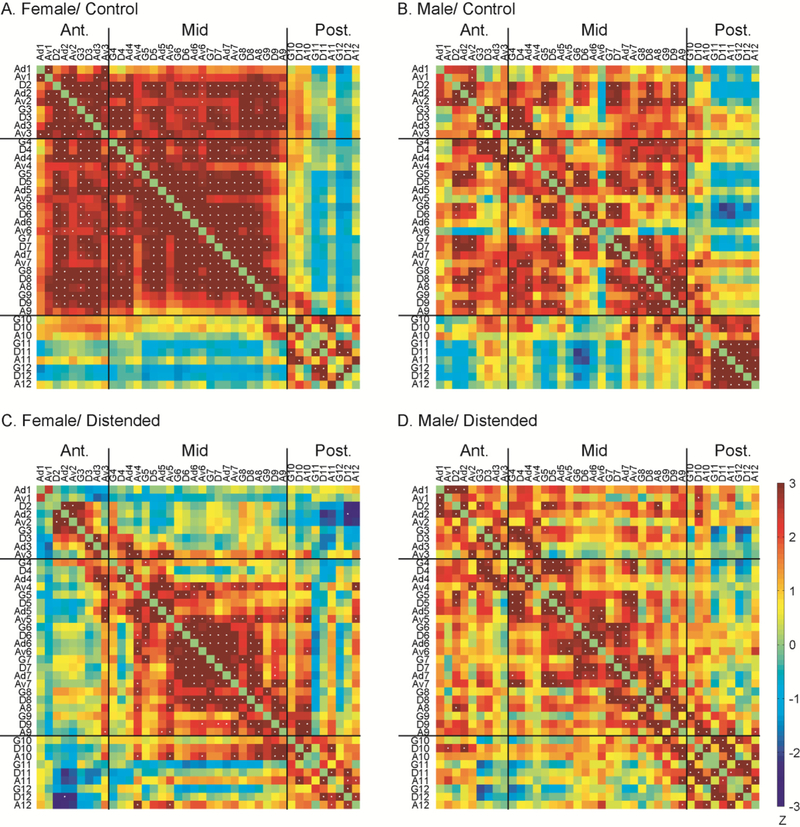
Fig. 2.
Intra-insular functional connectivity. Inter-regional correlation matrices show functional connectivity patterns within the insular cortex in the female/control (A), male/control (B), female/distended (C), and male/distended group (D). Z values of Pearson’s correlation coefficients are color-coded. Positive and negative correlations are denoted with warm and cold colors, respectively. Statistically significant correlations determined by the jackknife procedure are marked with white dots. Segregations in functional connectivity across the groups suggested a subdivision of the insular into three subregions: an anterior, a mid, and a posterior part. G: granular; D: dysgranular; A: agranular; Ad: dorsal agranular; Av: ventral agranular.

