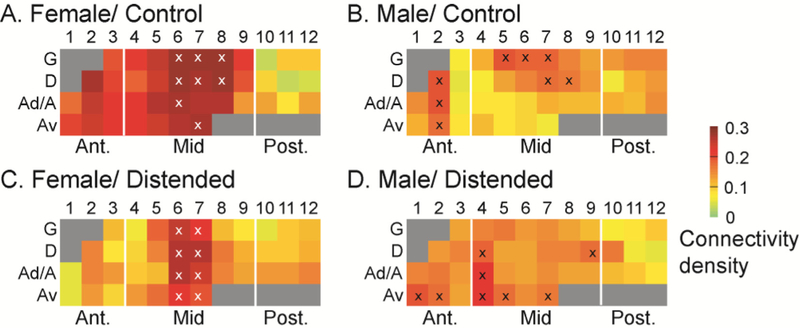
Fig. 5.
Whole-brain functional connectivity density of the insular cortex. The female/control group (A) showed the highest level of whole-brain functional connectivity density at 0.20 (mean of 40 ROIs), which was reduced to 0.14 (−30 %) in the female/distended group (C). In contrast, the average connectivity density in the male/control (B) and male/distended group (D) was 0.12 and 0.14 (+17%), respectively. Regions of interest with the highest density (top 20%) are marked with the symbol ‘x’.

