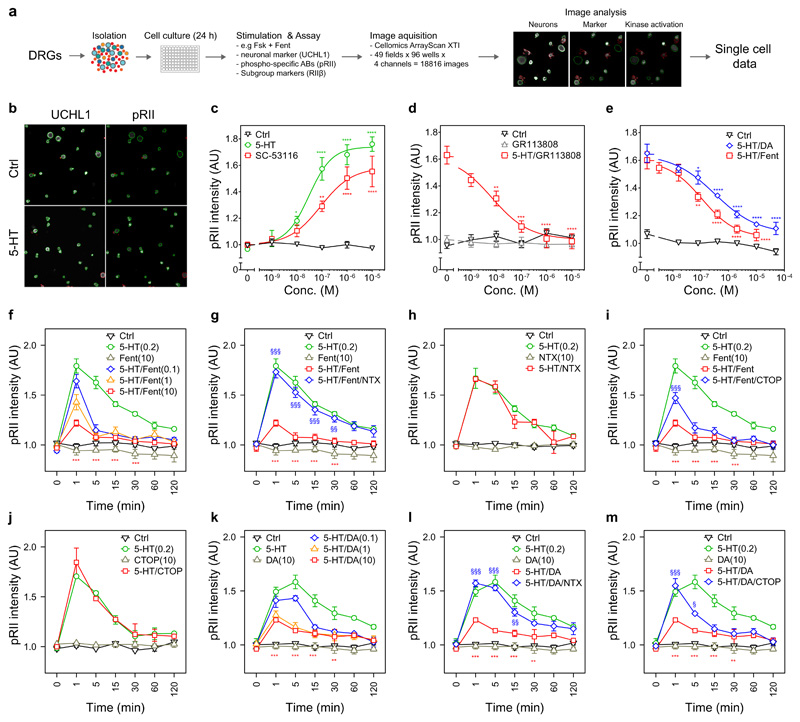
Fig. 1. 5-HT-induced increase of pRII is mediated by 5-HT4 receptors and inhibited by opioids in rat sensory neurons.
(A) Representative images of rat sensory neurons from dorsal root ganglion that were stimulated with solvent (control, Ctrl) or 5-HT (0.2 µM) for 3 min. Cultures were stained with UCHL1 to identify the neurons and pRII to quantify PKA-II signaling activity. Green or red encircled neurons indicate automatically selected or rejected objects, respectively. Scale bar, 100 µm. (B) Dose response curve showing the pRII intensities in selected neurons exposed to 5-HT (0-10 µM, EC50 = 30 nM) or the 5-HT4-specific agonist SC-53116 (0-10 µM, EC50 = 89 nM) for 3 min. (C) Dose response curve showing the effect of the 5-HT4-specific antagonist GR113808 (0-10 µM, IC50 = 8.6 nM) on pRII signals induced by 5-HT (0.2 µM). 5-HT and GR113808 were applied simultaneously. (D) Dose response curve showing the effect of fentanyl (Fent, 0-10 µM, IC50 = 97 nM) or the MOR-specific agonist DAMGO (DA, 0-50 µM, IC50 = 321 nM) on pRII signals induced by 5-HT (0.2 µM) (Difference of pIC50: F1,47 = 4.2, n = 4, P < 0.05, extra-sum-of-squares F test). (E) Time-course experiment showing the dose-dependent effect of fentanyl on pRII signals induced by 5-HT (Dose effect: F3,84 = 77.2, n = 4, P < 2e-16). (F) Time-course experiment showing the effect of the opioid receptor antagonist naltrexone (NTX, 10 µM) on the inhibition of the 5-HT-induced pRII signal by fentanyl (F1,42 = 136, n = 4, P < 9.5e-15). (G) The effect of naltrexone on the baseline or 5-HT-induced pRII signal. (H) The effect of the MOR antagonist CTOP (10 µM) on the inhibition of the 5-HT-induced pRII signal by fentanyl (F1,42 = 12, n = 4, P < 0.01). (I) The effect of CTOP on the baseline or 5-HT-induced pRII signal. (J) The effect of DAMGO on the 5-HT-induced pRII signal (Dose effect: F3,56 = 51, n = 3, P < 5e-16). (K and L) Effect of naltrexone and CTOP on the inhibition of the 5-HT-induced pRII signal by DAMGO. In (B) to (L), concentrations are indicated in micromolar; control conditions were treated with solvent; data are presented as means ± SEM; n = 3 to 4 independent experiments; >2000 neurons/condition; two-way ANOVA with Bonferroni’s test; *P<0.05; **P<0.01; ***P<0.001 indicate significance levels between baseline and stimulated conditions; §P<0.05; §§P<0.01; §§§P<0.001 indicate significance levels between stimulated and inhibited conditions.

