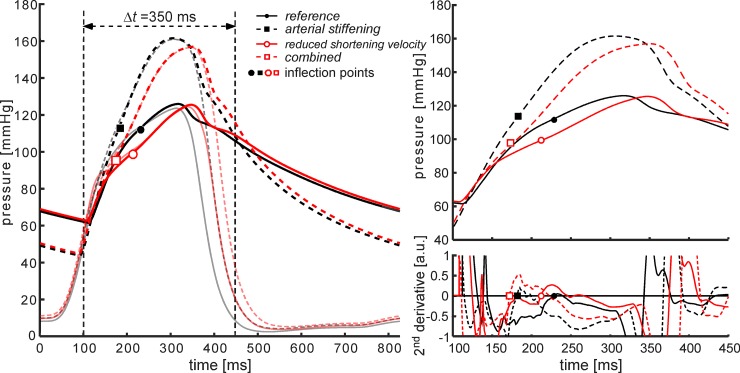
Fig. 3.
Aortic and left ventricular pressure curves for the four simulated scenarios. Left: overview of simulated left ventricular and aortic pressure waveforms for four simulated scenarios. Right: closer look at the systolic segment (t = 100–450 ms) of the pressure waveforms (top) and their second-order derivatives (bottom). Right: inflection points (black and red symbols, respectively) are located by determining the zero-crossing of the second-order derivative of each simulated waveform.

