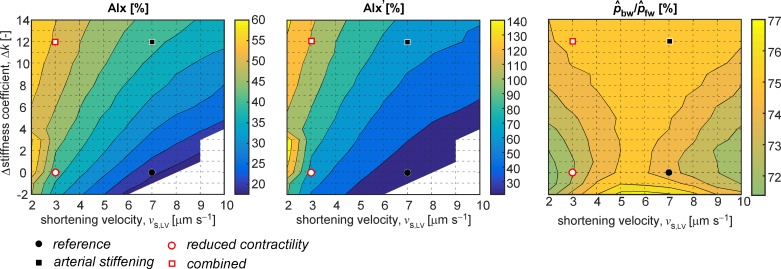
Fig. 5.
Contour plots indicating the relationship between the changes in LV shortening velocity and arterial stiffness and the wave reflection indices considered: AIx (left), AIx′ (middle), and / (right). The distinct simulated scenarios are highlighted by the circles and squares, as indicated. Each grid point corresponds to a single simulation. LV shortening velocity parameter vs,LV was varied from 2 µm/s to 10 µm/s with 1 µm/s increments, and arterial stiffness parameter ∆k was varied between –2 and +14 with increments of 1.

