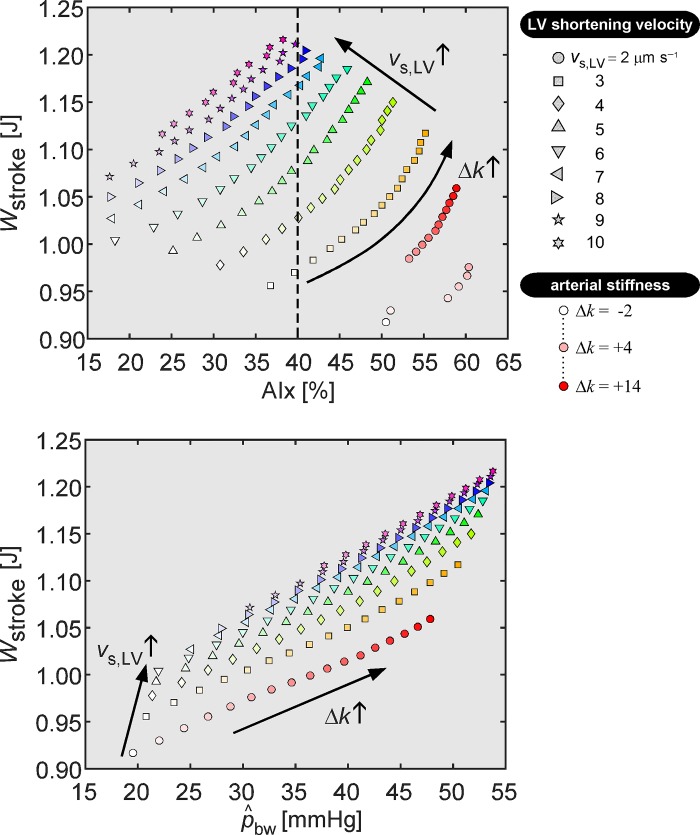
Fig. 6.
Relation between left ventricular stroke work (Wstroke) and wave reflection indices, i.e., augmentation index (AIx) and backward pressure amplitude (), respectively. Each symbol represents a simulation with a particular left ventricular sarcomere shortening velocity (vs,LV; indicated by symbol type) and imposed arterial stiffness (∆k; indicated using symbol color saturation). Top: scatterplot indicating the relation between AIx and Wstroke. The dashed line illustrates variation in Wstroke values at an AIx value often found in elderly patients (see text). Bottom: scatterplot displaying the relation between as determined using wave separation and Wstroke. Arrows indicate the direction of changes in vs,LV and ∆k for the simulations.

