
Figure 6.
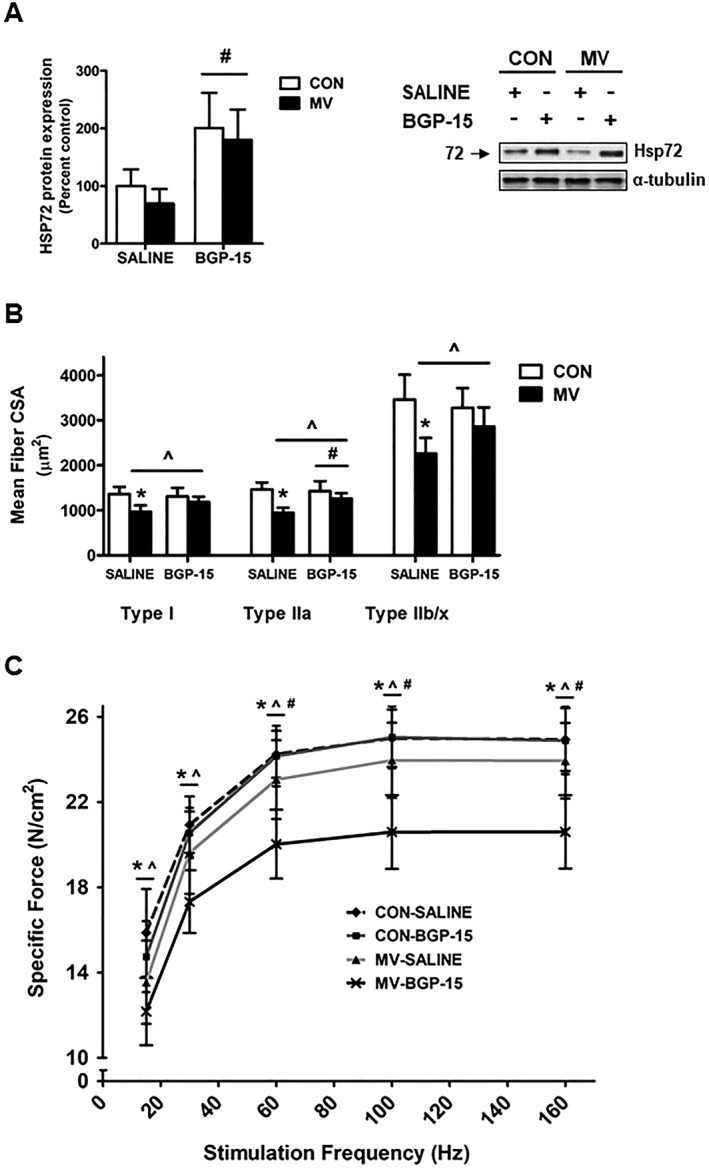
Effect of BGP‐15 administration on diaphragm function. (A) HSP72 protein expression. Representative western blot images are shown to the right of the graph. (B) Diaphragm muscle cross‐sectional area (CSA) of myosin heavy chain (MHC) Types I, IIa, and IIb/x fibres. (C) Diaphragm muscle specific force production. Values are presented as mean ± SD. CON = acutely anaesthetized control; MV = mechanical ventilation; SALINE = saline treatment; BGP‐15 = BGP‐15 treatment. * = MV significantly different versus CON within treatment (P < 0.05). ^ = main effects for MV (P < 0.05). # = main effects for BGP‐15 (P < 0.05).