
Figure 7.
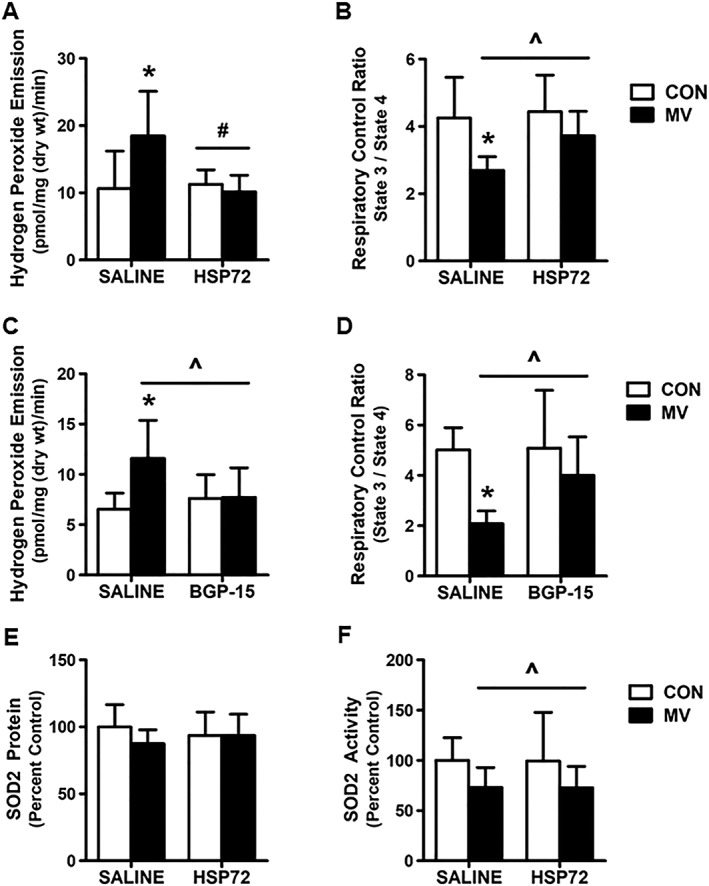
Effect of HSP72 overexpression on markers of mitochondrial function. (A) and (C) mitochondrial ROS emission; (B) and (D) respiratory control ratio (RCR); (E) SOD2 protein expression; and (F) SOD2 activity. Values are presented as mean ± SD. CON = acutely anaesthetized control; MV = mechanical ventilation; SALINE = saline treatment; HSP72 = AAV‐HSP72 overexpression; BGP‐15 = BGP‐15 treatment. * = MV significantly different versus CON within treatment (P < 0.05). ^ = main effects for MV (P < 0.05). # = main effects for HSP72 (P < 0.05).