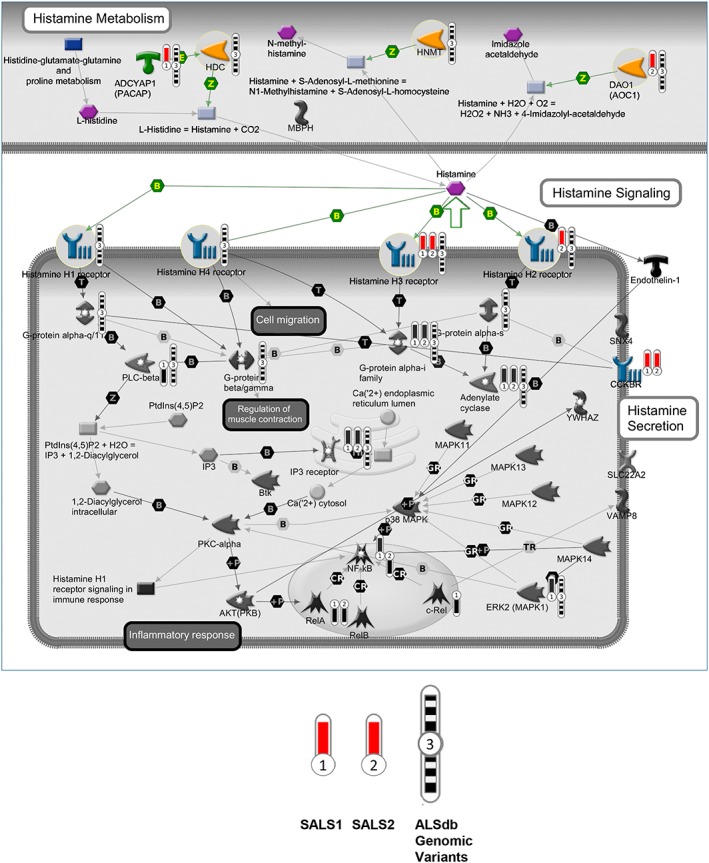
Figure 1.

CNVs, SNVs/indels on histamine‐related metabolism and signalling pathways. The interaction pathway map represents the functional correlation between multi‐omic data (CNV, SNV/Indel) from sALS affecting histamine‐related genes and their signalling cascades. The map was created using the MetaCore pathway map Creator tool (GeneGo). Network objects related to genes specifically involved in histamine receptors, metabolism, and transport were reported as coloured objects. CNV values are presented on the map as ‘thermometer‐like’ symbols with sALS1 patients data represented as thermometer #1 and sALS2 patients #2. Genes associated with CNV gain regions are labelled with red dots. The thermometers with black/white stripes and #3 are the ALS genomic variants. ALS, amyotrophic lateral sclerosis; CNV, copy number variant; sALS, sporadic ALS; SNV, single nucleotide variant.
