
Figure 3.
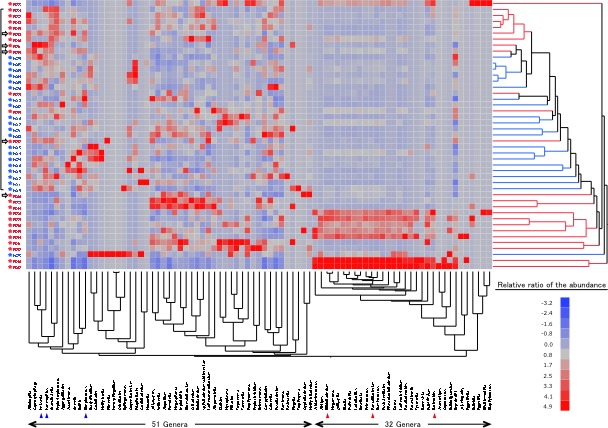
Interindividual bacterial compositional variation at the genus level. The samples from 45 subjects and 83 dominant genera are represented on a double-hierarchical clustering heat map. The blue and red squares represent lower and higher abundances, respectively. The clusters on the right side indicate the similarity among individual profiles at the genus level. The clusters at the bottom indicate the genera showing similarity in the frequency of identification among samples. Cited with permission from ref 35.