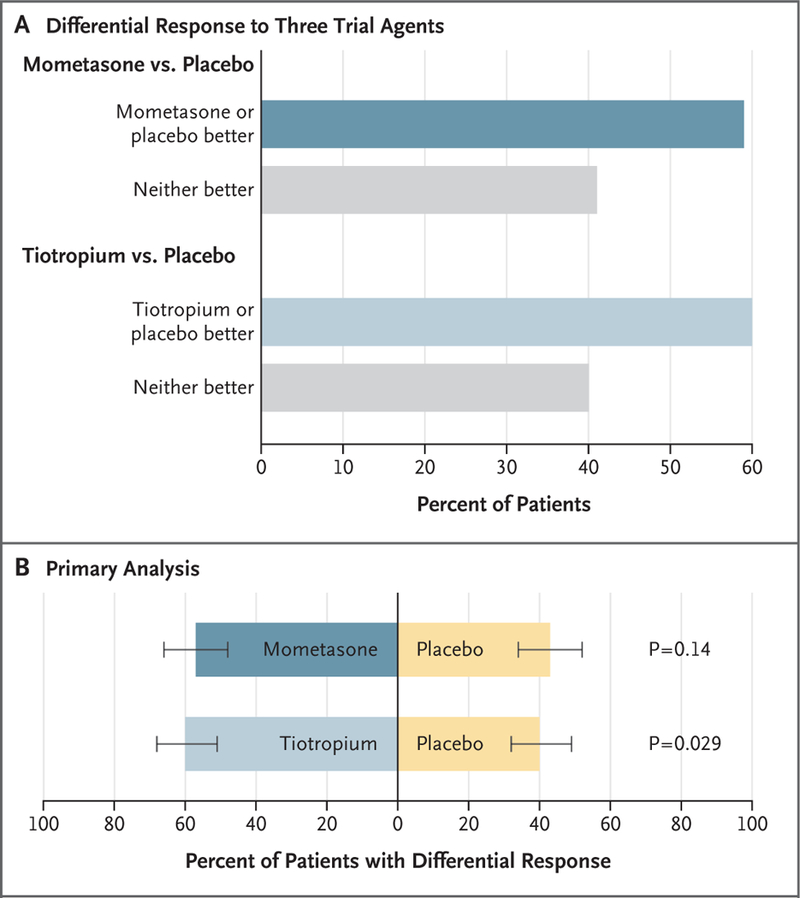
Figure 2. Pairwise Comparisons of Active Treatments and Placebo in the Low-Eosinophil Stratum.

In this trial, the primary outcome was the response to mometasone as compared with placebo and to tiotropium as compared with placebo among patients with a low sputum eosinophil level (<2%) who had a pre-specified differential response to the trial agents. The response was determined according to a hierarchical composite outcome that incorporated treatment failure, asthma control days, and the forced expiratory volume in 1 second. Panel A shows the prespecified differential response to treatment with mometasone as compared with placebo and with tiotropium as compared with placebo. The patients were considered to have had a differential response if the response during at least one trial period was ranked better than the response during another trial period. In the comparison between mometasone and placebo, 34% of the patients had better asthma control while receiving mometasone, 25% had better control while receiving placebo, 21% showed no between-group difference, and 20% with missing data were imputed as having no between-group difference. In the comparison between tiotropium and placebo, 36% had better control while receiving tiotropium, 24% had better control while receiving placebo, 22% showed no between-group difference, and 18% with missing data were imputed as having no between-group difference. Panel B shows the results of a statistical comparison of the primary outcome among the patients who had a differential response to the trial agents, with a two-sided P value of less than 0.025 indicating statistical significance. There was no significant between-group difference in the percentage of patients who had a better response to mometasone than to placebo (57% vs. 43%, P=0.14) or in the percentage who had a better response to tiotropium than to placebo (60% vs. 40%, P=0.029). The I bars denote the 95% confidence interval.
