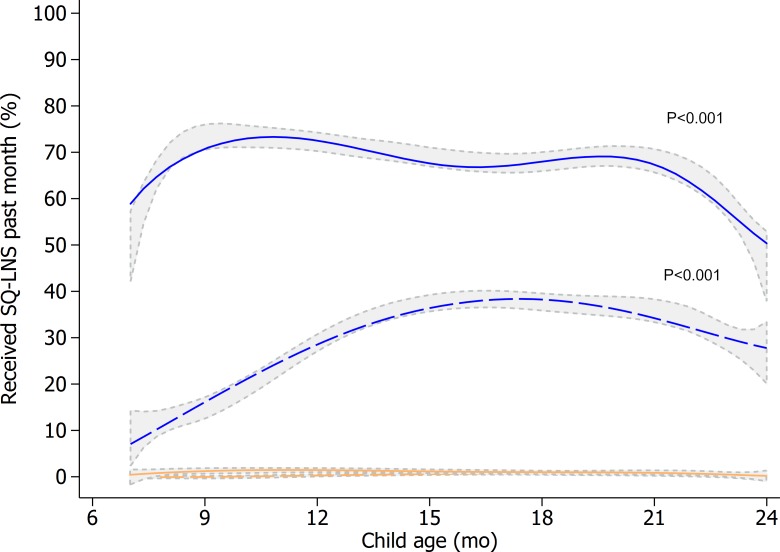
Fig 3. Total SQ-LNS coverage and SQ-LNS coverage through the meeting with CHVs in the longitudinal study by child age and by study arm.
Line graphs represent the fitted values of the proportion of children who received SQ-LNS in the intervention arm (blue) and the comparison arm (orange) through the monthly meeting with CHV (dashed lines) or from any source (solid line). Gray areas represent 95% confidence bands of kernel-weighted local polynomial smoothed values by study arm using the observed data. Analysis is based on n = 9,424 child visits in the comparison arm and n = 9,434 in the intervention arm. Mixed-effects regression models with restricted cubic splines (knots at 9, 15, and 22 months of child age) were used with health center catchment area and child as random intercepts and health district, sampling strata, month of inclusion, child sex, whether the child was a first live birth or not, age splines, and intervention as fixed effects. A chunk Wald test was used to test the “age spline × intervention” interaction terms (p-values shown). CHV, community health volunteer; SQ-LNS, small-quantity lipid-based nutrient supplement.

