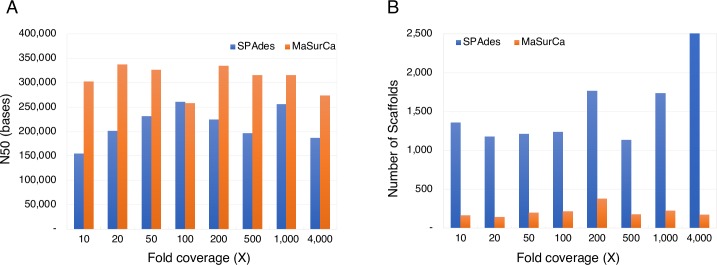
Fig 4. The effects of sequencing fold coverage on assembly quality.
We generated sequence datasets with various sequencing fold coverages via random sampling of very deep coverage sequencing data, and applied two assembly pipelines: SPAdes and MaSurCA. (A) The assembly using SPAdes with 100× coverage showed the highest N50 value, while the one using MaSurCA with 20× coverage had the highest N50. (B) Sequencing data at 500× coverage yielded an assembly with the fewest scaffolds using SPAdes, while that with 20× coverage generated the fewest using MaSurCA.

