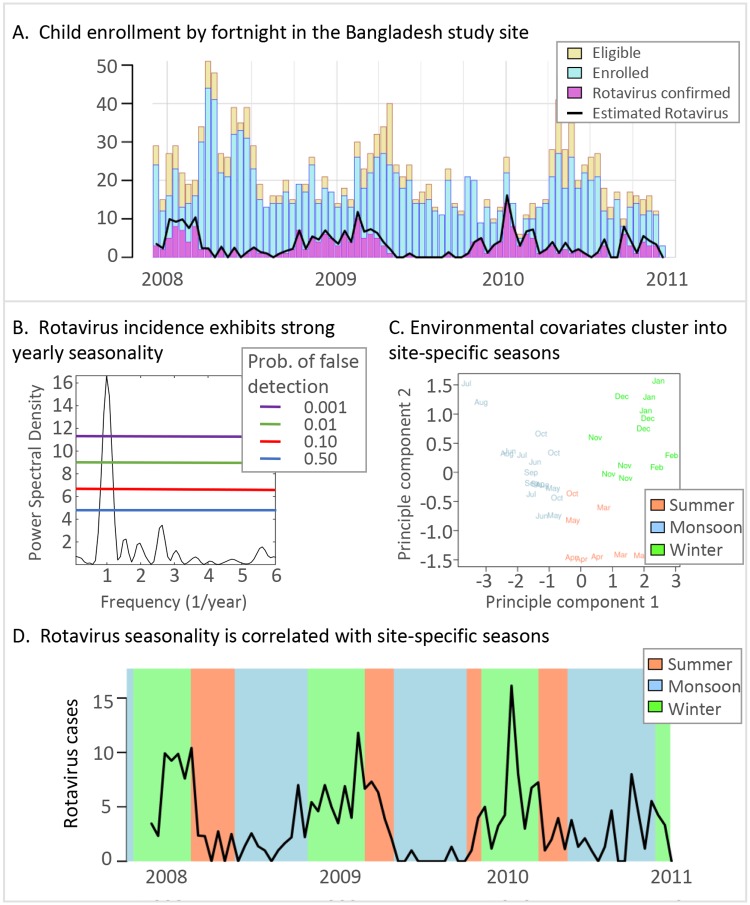
Fig 1. Analysis overview.
A. The number of eligible and enrolled children for the Bangladesh study site each fortnight (gold and blue bars, respectively). The number of rotavirus-confirmed samples from enrolled children are in purple. The estimated rotavirus prevalence among all eligible children which includes confirmed positive and estimated positive from the eligible children is illustrated by the black line. B. The power spectral density of the estimated rotavirus positive prevalence time series. Each colored line indicates the probability of a random time series signal with the same length and sampling being misinterpreted as a true signal. C. Seasons were identified using PCA to reduce the dimensionality of the weather variables and k-means clustering. The color of each month corresponds to the cluster and season. For Bangladesh, we call each season by the colloquial names “Summer,” “Monsoon,” and “Winter”. D. The estimated number of cases positive for a pathogen each fortnight (black line). Each background color corresponds to the data-driven season identified in C.

