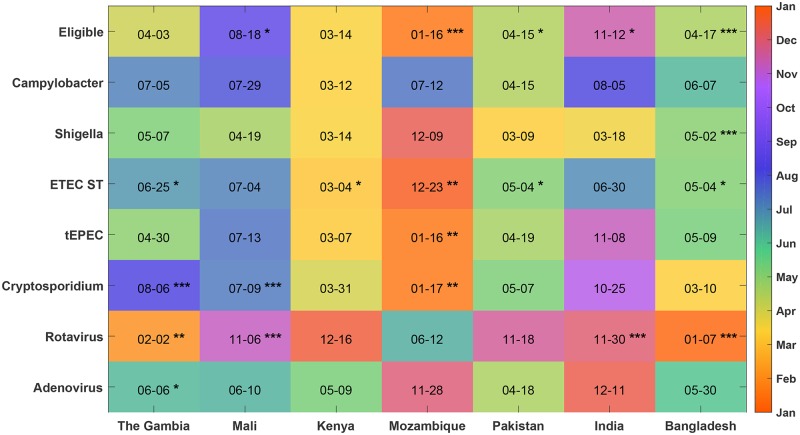
Fig 2. Annual peak dates of pathogens.
We used the phase information from the FFT of the number of eligible children estimated to be positive each fortnight to determine the date of the annual peak of each pathogen in each country (indicated as month–day in each square and color-coded by month of year). The significance (false-detection rate pfd) of the annual cycle was obtained from the Lomb–Scargle periodogram of the most significant period between 11 and 13 months, indicated by **** for <0.1%, *** for <1%, ** for <5%, and * for <10%.

