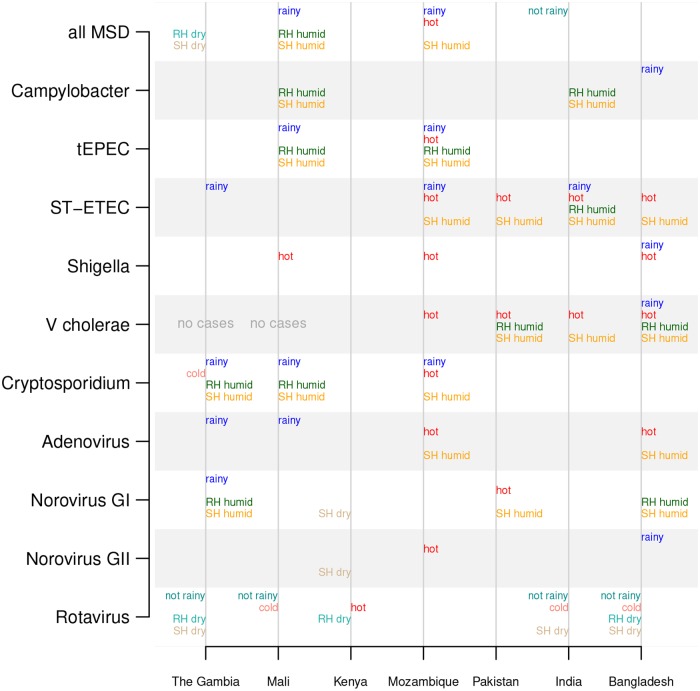
Fig 4. Significant differences in weather of fortnights with high vs low pathogen prevalence.
The weather covariates with significant differences (p<0.05 using the Wilcoxon rank–sum test) between fortnights with high vs low prevalence of pathogens are printed in the chart. Weather covariates that are higher during high-prevalence weeks are printed to the right of the vertical lines (“rainy” indicates higher rain in pathogen-associated fortnights, “hot” means higher temperatures, “RH humid” means higher relative humidity, and “SH humid” means higher specific humidity), and those that are lower during high-prevalence weeks are printed on the left (i.e., “not rainy”, “cold”, “RH dry”, and “SH dry”).

