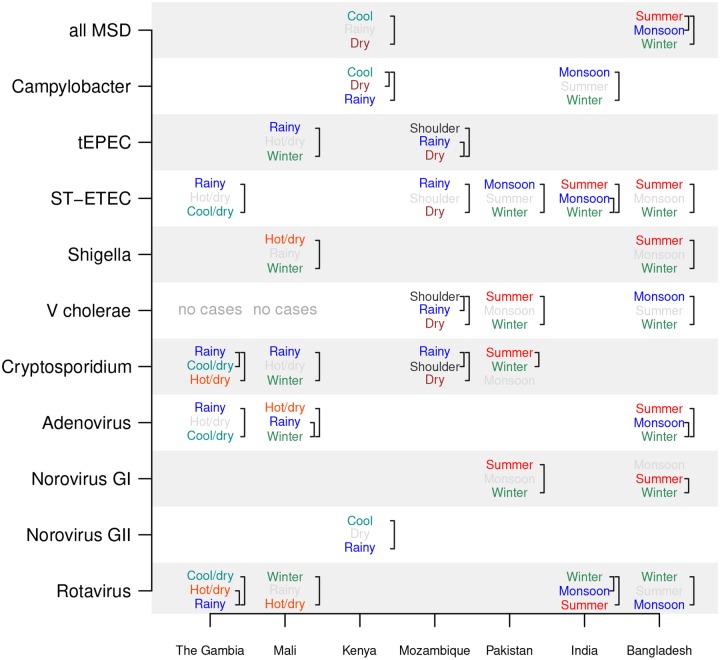
Fig 5. Relative prevalence of pathogens across seasons.
The Dunn test is used to compare the monthly cases between pairs of seasons. If there is a significant difference between seasons, their names are printed, with the season with the most cases per month on top and fewest on the bottom. Brackets indicate pairs of seasons with significant differences, and season names are color-coded (summer, winter, monsoon, hot/dry, cool/dry, etc) when there is a statistically significant difference between seasons (p<0.05 using a Bonferroni correction) and light gray otherwise. No country–pathogen combination had significant prevalence differences among all three seasons.

