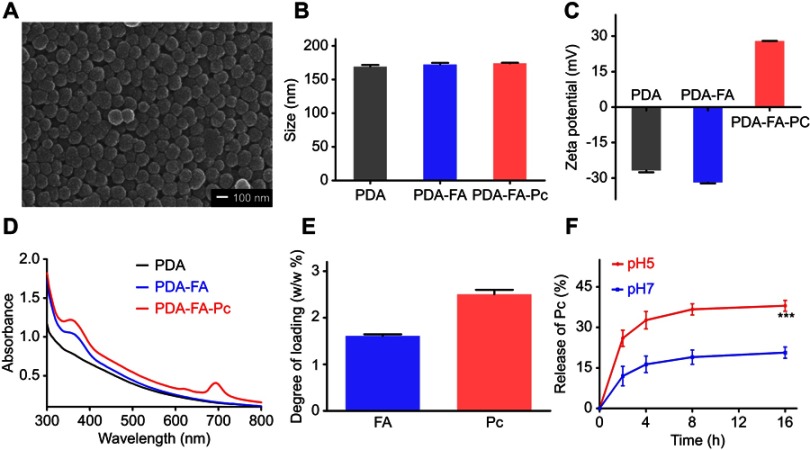
Figure 2.
Characterization of PDA-FA-Pc nanomedicine. (A) The scanning electron microscopy image of PDA-FA-Pc nanomedicine. (B) The size distributions of PDA, PDA-FA and PDA-FA-Pc nanomedicine in water measured by DLS. (C) Zeta potentials of PDA, PDA-FA and PDA-FA-Pc nanomedicine. (D) UV-vis absorption spectra of PDA, PDA-FA and PDA-FA-Pc nanomedicine. The UV-vis absorption spectra of pure FA and Pc were shown in Figure S3. (E) The degree of loading (DOL) of FA and Pc in PDA-FA-Pc nanomedicine (w/w %). (F) The release of the monomeric Pc molecules from PDA-FA-Pc nanomedicine in acidic (pH 5) and neutralized (pH 7) conditions. The values were represented as mean ± SD, ***p <0.001.

