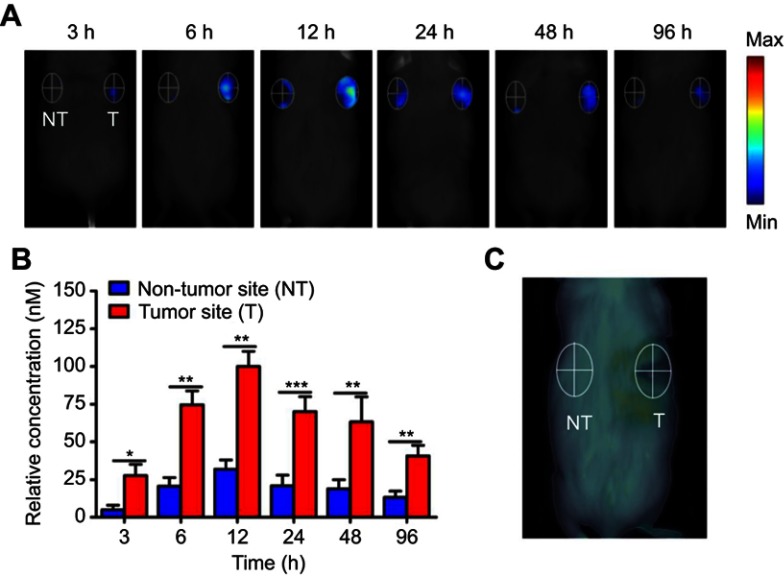
Figure 6.
In vivo imaging of PDA-FA-Pc nanomedicine by fluorescent molecular tomography (FMT) imaging of Pc fluorescence in MCF-7 tumor-bearing mice. (A) Imaging graphics of PDA-FA-Pc at the tumor site (T, right) and non-tumor site (NT, left) at 3, 6, 12, 24, 48, and 96 h after intravenious injection. (B) Quantitations of Pc relative concentrations at the non-tumor (NT) and tumor sites (T) at different time points in panel a. (C) The non-tumor (NT) and tumor sites (T) of the saline treated mice showed non-measurable Pc fluorescence signal. The values were represented as mean ± SEM, ***p<0.001, **p<0.01, *p<0.05 vs the fluorescence signals at the NT site.

