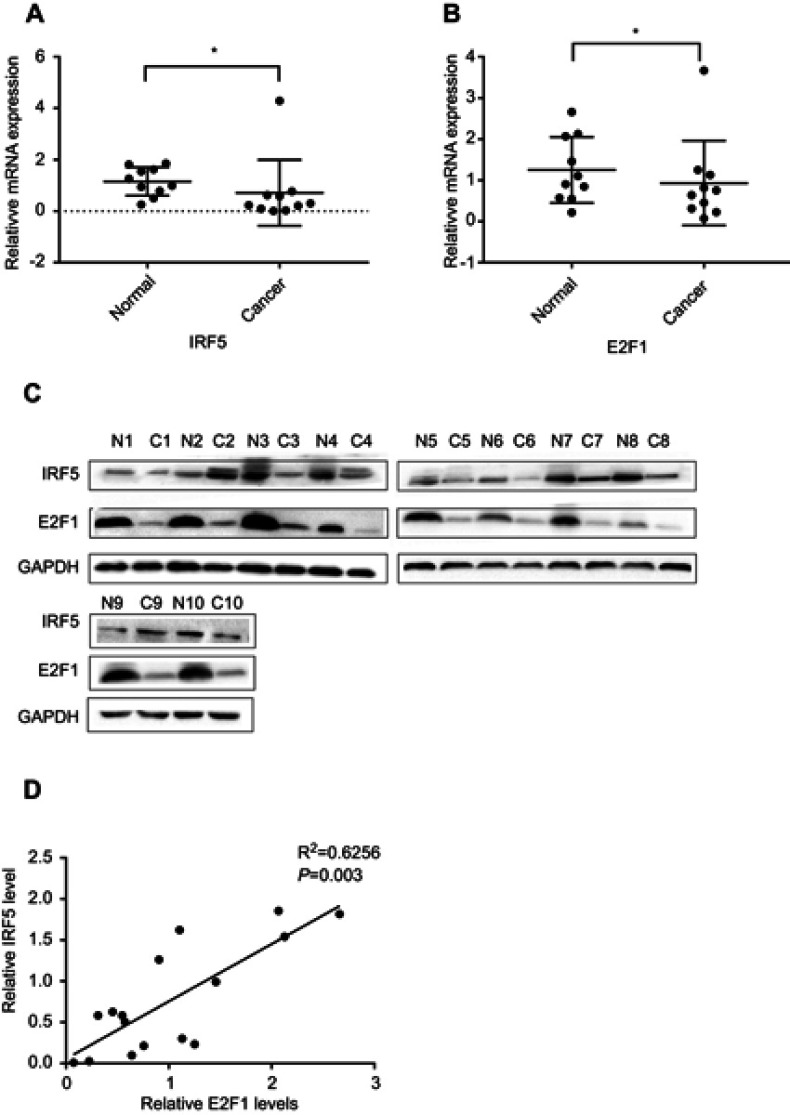
Figure 1.
IRF5 and E2F1 are reduced in human NSCLC tissues. (A and B) The expression of E2F1 and IRF5 was analyzed by qRT-PCR (*p < 0.05). (C) Protein levels of E2F1 and IRF5 between normal and cancer in NSCLC. (D) The correlation between E2F1 and IRF5 was tested with the Pearson correlation test. The differences in expression levels of E2F1 and IRF5 between normal tissues and cancers were determined using a paired t-test. The mRNA and protein levels of E2F1 and IRF5 were compared with GAPDH.

