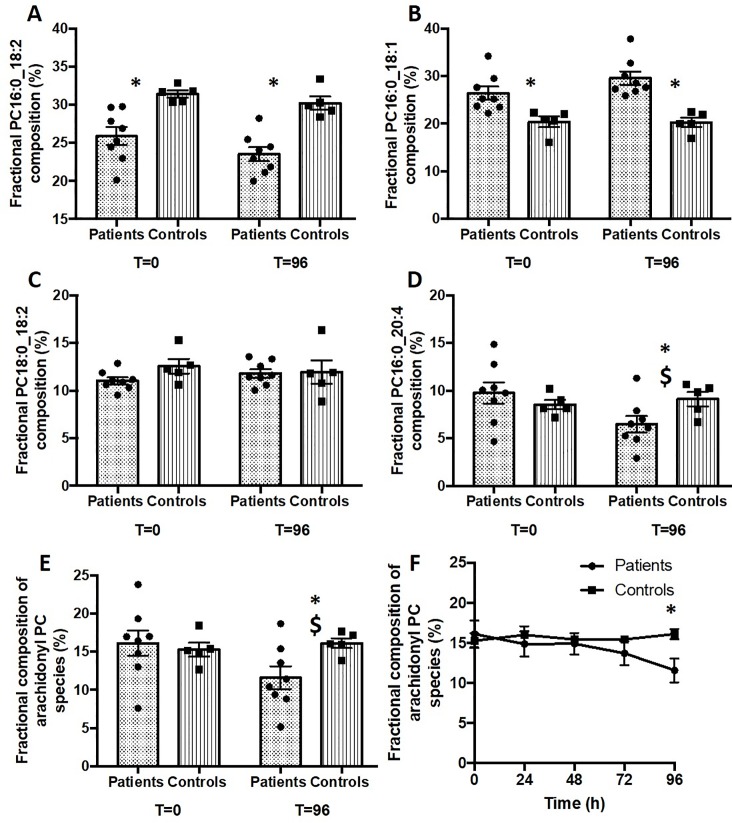
Fig 2. Compositional variation of major selected erythrocyte PC species between ARDS patients and healthy controls.
Results are shown as both grouped and individual data at baseline and 96 hours for A) PC16:0_18:2, B) PC16:0_18:1, C) 18:0_18:2 and D) 16:0_20:4 and E) total arachidonoyl-containing PC. Panel F details the overall gradual change with time for total arachidonoyl-PC. *P<0.05 comparison between patients and controls. $P<0.05 for comparison between 0 and 96 hours in ARDS patients.

