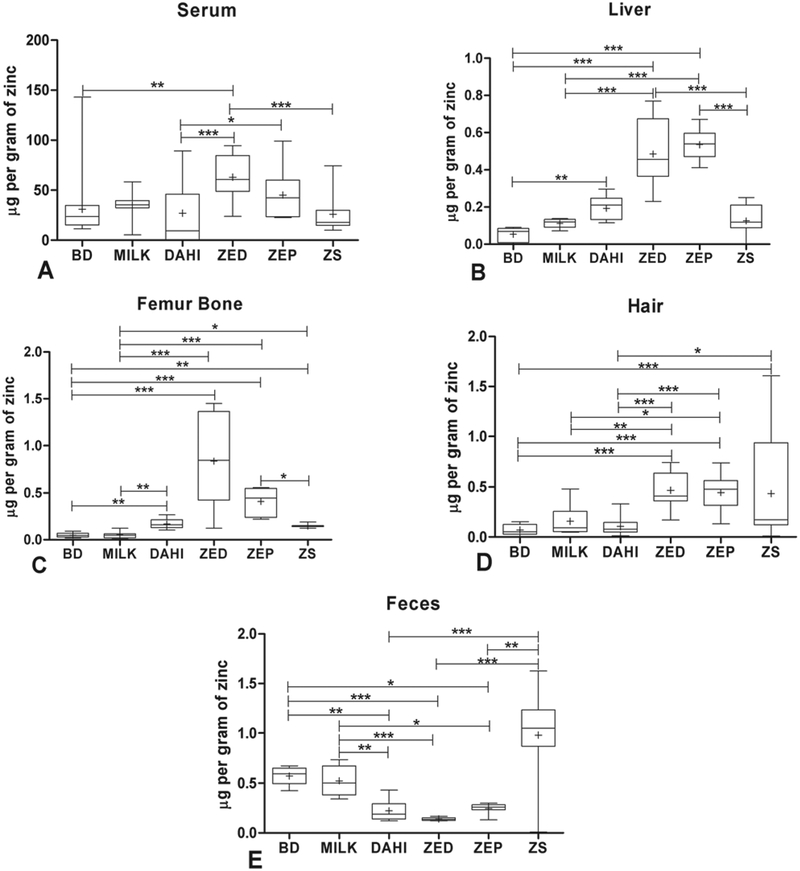
FIGURE 4. Estimation of Zinc concentration in different body fluid/organs/parts in Wistar rats.
A. Serum; B. Liver; C. Femur bone; D. Hair; E. Feces. Box and Whisker plots showing the bioavailability of zinc in different body part after three weeks of treatment with six different diets. All the readings were recorded after 3 weeks of 6 different diet treatments after Zinc deficiency. Center lines show the medians; ‘+’ sign shows the mean value; box limits indicate the 25th and 75th percentiles; whiskers extend 1.5 times the interquartile range from the 25th and 75th percentiles, n = 24 where 8 animals/group, and all reading were taken in triplicates. *p< 0.05, **p<0.01 ***p<0.001.

