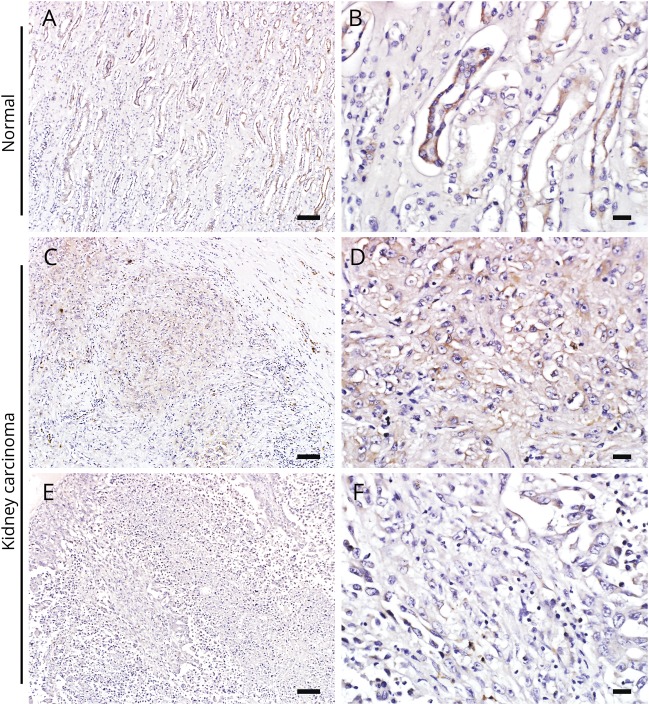
Figure 3. Immunohistochemistry of renal cell carcinoma (patient 4).
(A, B) Phosphodiesterase 10A (PDE10A) immunohistochemistry in normal control human kidney tissue. The high power image (B) indicates the collecting tubular epithelium with marked expression of PDE10A. The kidney carcinoma tissue of patient 4 shows foci of variable PDE10A immunoreactivity: moderate expression (C, D) or scant PDE10A expression (E, F) in different parts of the tumor. Scale bars in A, C, and E = 100 μm. Scale bars in B, D, and F = 20 μm.

