Abstract
Objective
To determine whether lower socioeconomic status (SES) and longer home to hospital driving time are associated with reductions in tissue plasminogen activator (tPA) administration and timeliness of the treatment.
Methods
We conducted a retrospective observational study using data from the Get With The Guidelines–Stroke Registry (GWTG-Stroke) between January 2015 and March 2017. The study included 118,683 ischemic stroke patients age ≥18 who were transported by emergency medical services to one of 1,489 US hospitals. We defined each patient's SES based on zip code median household income. We calculated the driving time between each patient's home zip code and the hospital where he or she was treated using the Google Maps Directions Application Programing Interface. The primary outcomes were tPA administration and onset-to-arrival time (OTA). Outcomes were analyzed using hierarchical multivariable logistic regression models.
Results
SES was not associated with OTA (p = 0.31) or tPA administration (p = 0.47), but was associated with the secondary outcomes of onset-to-treatment time (OTT) (p = 0.0160) and in-hospital mortality (p = 0.0037), with higher SES associated with shorter OTT and lower in-hospital mortality. Driving time was associated with tPA administration (p < 0.001) and OTA (p < 0.0001), with lower odds of tPA (0.83, 0.79–0.88) and longer OTA (1.30, 1.24–1.35) in patients with the longest vs shortest driving time quartiles. Lower SES quintiles were associated with slightly longer driving time quartiles (p = 0.0029), but there was no interaction between the SES and driving time for either OTA (p = 0.1145) or tPA (p = 0.6103).
Conclusions
Longer driving times were associated with lower odds of tPA administration and longer OTA; however, SES did not modify these associations.
Only 7% of patients hospitalized with acute ischemic stroke receive IV tissue plasminogen activator (tPA).1 While recent studies2,3 demonstrate the efficacy associated with expanded time windows for reperfusion, earlier thrombolysis leads to better outcomes.4
Socioeconomic status (SES), measured by zip code median income, has been shown to be associated with less timely tPA access.5 Timely stroke treatment may also be impeded by the distance that patients need to travel in order to get to a tPA-capable facility.6–11
We were interested in further investigating the effects of low SES on timely ischemic stroke treatment, and to determine whether longer driving times may account for low SES patients having longer onset to arrival times (OTA) and lower odds of tPA administration. Low SES patients may have longer driving times than high SES patients, and low SES, through delayed emergency medical services (EMS) activation or responsiveness, may amplify the association with driving time.12
Using data from the American Heart Association's Get With The Guidelines–Stroke program (GWTG-Stroke), we sought to determine whether patients with low SES and patients with longer driving times transported by EMS have longer OTA or a lower frequency of tPA administration. We also wanted to know whether patients of low SES have longer driving times than patients of high SES, and whether SES modifies the association between driving time and OTA or tPA administration. This analysis assesses whether there are certain populations who are particularly vulnerable to delayed arrival, such as low SES patients who live far from the hospital.
Methods
Data collection
Data were collected from the American Heart Association GWTG-Stroke, a voluntary national registry database, which, since 2003, has collected a range of data from hospitals across the United States about patients with a diagnosis of stroke. Collected data include information such as stroke etiology, patient demographics, medical history, symptom and treatment timeline, and patient outcomes. The range of GWTG-Stroke variables, the collection methodology, and the validity and reliability of the measures has been described previously.13–15
Population
The study population includes adult patients (age ≥18) who had a final diagnosis of ischemic stroke from January 2015 (when GWTG-Stroke zip code information first became available) to March 2017. Patients were limited to those who were treated at a site that recorded >25% of requested patient medical history to GWTG-Stroke. The study includes patients who had an onset of symptoms in a non–health care setting and were brought to the hospital by EMS. We limited the analysis to patients brought in by EMS in order to focus on the role of SES and distance among EMS care. To be included, patients were required to have a recorded home zip code that was geocodable, within one of the 48 contiguous United States, and less than 100 miles from the treatment hospital. Patients were excluded if they were transferred from another hospital for IV tPA or intra-arterial (IA) catheter-based treatment, or if they received these treatments from the transferring hospital. Patients were also excluded if they had an OTA greater than 24 hours, as these patients were unlikely to receive timely reperfusion regardless of driving time. For the analysis of driving time and tPA administration only, patients were excluded if they had documented contraindications or warnings to receiving tPA (figure).
Figure. Inclusion/exclusion criteria.
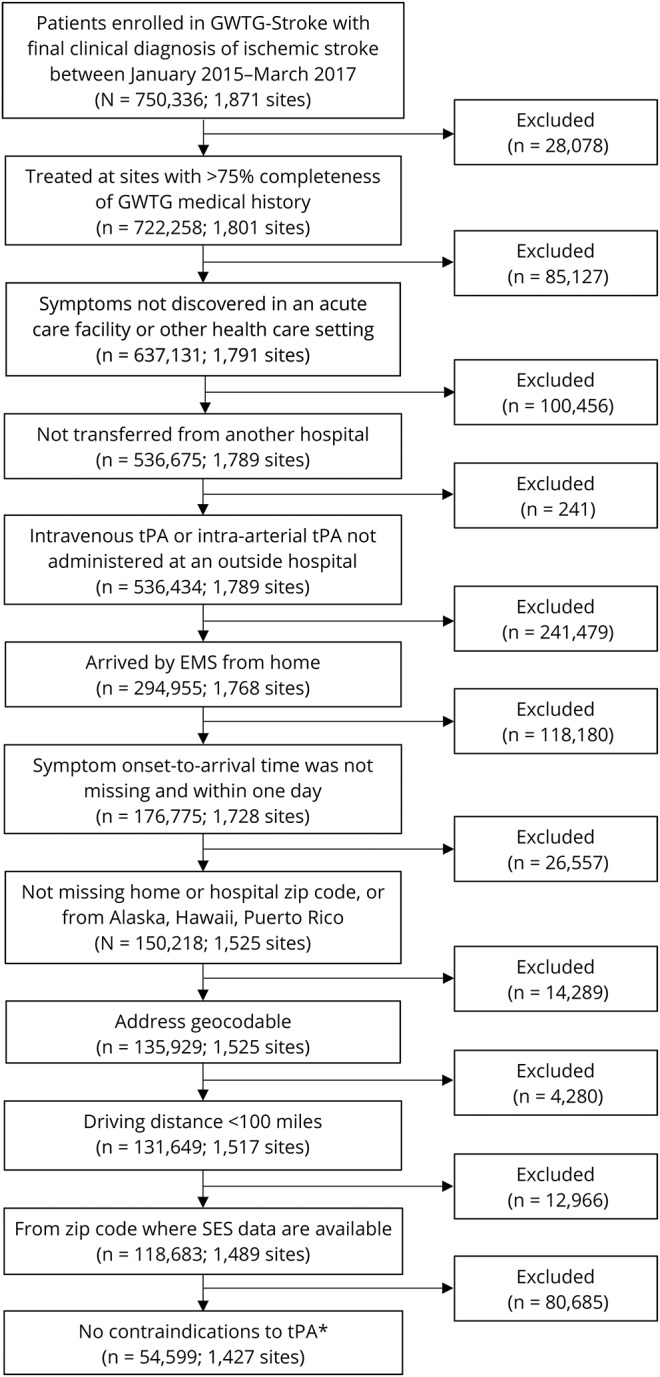
*Exclusion of patients with contraindications to tissue plasminogen activator (tPA) was applied only to the tPA analysis. EMS = emergency medical services; GWTG-Stroke = Get With The Guidelines–Stroke; SES = socioeconomic status.
Study measures
We determined the SES of each patient's home zip code by determining his or her zip code median household income, based on 2015 US Census data.16 Patients were then classified according to zip code median household income quintile, based on the total study population.
Driving times were estimated based on the patient's home zip code and the address of the treating hospital. We first used the SAS geocode procedure to identify the geographic coordinates of each patient's home zip code.17 We used the same procedure to determine the geographic coordinates of the treatment hospital street address. We then applied the patient home and hospital geographic coordinates, along with the hospital arrival time, to the Google Maps Directions Application Programming Interface (API). The Directions API uses Google Maps traffic data to calculate the driving time between the patient home zip code geographic coordinates and the hospital geographic coordinates.18 After determining individual driving times, patients were classified according to driving time quartiles.
Outcomes
The primary outcomes are OTA and tPA administration. To determine OTA, we calculated the difference between the date/time of discovery of stroke symptoms and the date/time of arrival to the hospital. We then classified patients according to the following OTA categories: <2 hours, 2–3.5 hours, 3.5–6 hours, >6 hours.
Patients who received IV tPA or IA tPA were identified based on documentation of these procedures in GWTG-Stroke.
As secondary outcomes, we determined each patient's onset to treatment time (OTT) (<2 hours, 2–3.5 hours, 3.5–6 hours, >6 hours), in-hospital mortality rate, discharge ambulatory status, discharge modified Rankin Scale (mRS) score (>2, >3 vs below), whether they were discharged to home, and whether they had a tPA complication of symptomatic intracranial hemorrhage (sICH) within 36 hours of tPA administration.
Statistical analysis
To assess home to hospital driving time, patient SES, and their interaction and association with the primary and secondary outcomes, we developed multivariable regression models using generalized estimating equation (GEE) to account for in-hospital clustering of patients. An ordinal logistic regression was run for the ordinal outcomes OTA and OTT and a binomial logistic regression was used for all other outcomes, which were binary. Hospital characteristics and patient variables were included in the GEE models. We used common variables for stroke standard analyses. The lists of variables were selected by clinicians and statisticians based on experience and previous model fitting. Hospital characteristics included in the models were bed size, acute ischemic stroke volume, tPA volume, region (Midwest, West, South, Northeast), urban/rural location, presence of a stroke center, and academic classification. Patient variables were age, sex, race, history of atrial fibrillation or flutter, previous stroke/TIA, coronary artery disease/prior myocardial infarction, carotid stenosis, diabetes (insulin and non-insulin-treated), peripheral vascular disease, hypertension, dyslipidemia, smoking, heart failure, and renal insufficiency. All of the variables were included in the model, regardless of statistical significance.
To determine whether SES modifies the association between driving time and the outcomes of interest (OTA and tPA), an SES quintile × driving time quartile interaction term was tested within each main effects model. Home zip code is used as a proxy for location of stroke onset; however, patients may have been away from home at the time of their stroke. To account for this, we included the variables “on hours” (weekdays 7 am–5 pm) and “off hours” (weekdays 5 pm–7 am, and all hours on Saturday and Sunday) in the GEE model, and assessed the interaction between off hour and driving time. Whenever an interaction term was deemed not significant (p > 0.05), we excluded it from the model.
Greater stroke severity, measured by NIH Stroke Scale (NIHSS), is likely associated with worse outcomes and different symptom onset to treatment times. Nevertheless, not all patients had their NIHSS measured. To account for this, we performed a sensitivity analysis, adjusting for NIHSS among patients with a completed NIHSS.
All variables had a low rate of missing data (<3%), except for NIHSS (4.9%), independent ambulation (7.1%), mRS at discharge (42.2%), and GWTG ischemic stroke–only estimated mortality rate (18.2%).
To assess the potential contribution of unmeasured confounding, E-values were calculated using the EValue package in R v3.2.5.19 Variance explained by the logistic models was calculated with the squared Pearson correlation method, while variance explained by the linear models was calculated directly from the model output in SAS.20
Data availability statement
Data were collected by the American Heart Association (the steward of the data according to contracts between the American Heart Association and participating hospitals), and are stored securely at the Duke Clinical Research Institute (DCRI). Given that data were collected for clinical care and quality improvement, rather than primarily for research, data sharing agreements require an application process in order for other researchers to access the data. Interested researchers can submit proposals to utilize GWTG for research purposes, including for validation purposes. Proposals can be submitted at heart.org/en/professional/quality-improvement/get-with-the-guidelines/get-with-the-guidelines-stroke/get-with-the-guidelines-stroke-overview. Additional information regarding the statistical analysis plan and analytic code may also be available from DCRI upon request.
Standard protocol approvals, registrations, and patient consents
All participating hospitals were required to comply with local regulatory and privacy guidelines and, if required, to secure institutional review board approval. Because data were used primarily at the local site for quality improvement, sites were granted waiver of informed consent under the common rule. The DCRI (Durham, NC) was granted institutional review board approval to analyze GWTG data for research.
Results
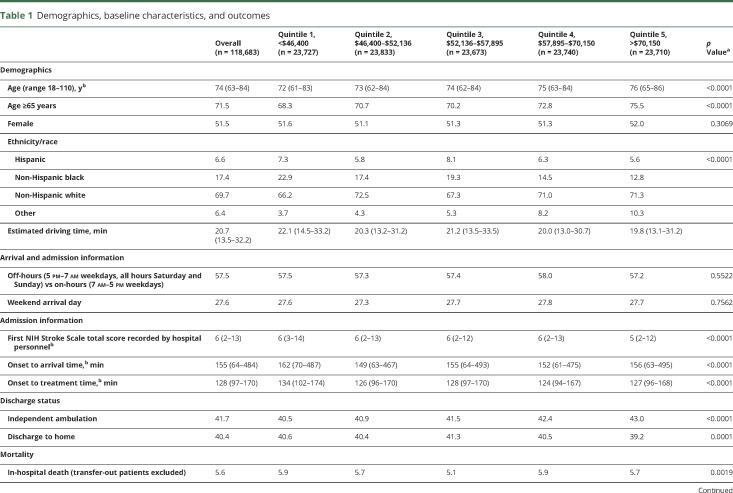
There were 118,683 patients from 1,489 hospitals included in the study (table 1). Patients had a median age of 74, were 51.5% female, 6.6% Hispanic, 17.4% non-Hispanic black, and 69.7% non-Hispanic white. Zip code median household income quintile boundaries at the 20th, 40th, 60th, and 80th percentiles were $46,400, $52,136, $57,895, and $70,150. Driving quartile boundaries were 13.5 minutes at the 25th percentile, 20.7 minutes at the 50th percentile, and 32.1 minutes at the 75th percentile. Patients had a median (interquartile range [IQR]) NIHSS of 6 (2–13) on arrival and a median OTA of 155 minutes (64–484). Among the 26.5% of patients who received IV tPA, there was a median OTT of 128 minutes (97–170). There was a 5.6% in-hospital mortality rate, and on discharge, 41.7% could independently ambulate and 40.4% were discharged to home.
Table 1.
Demographics, baseline characteristics, and outcomes
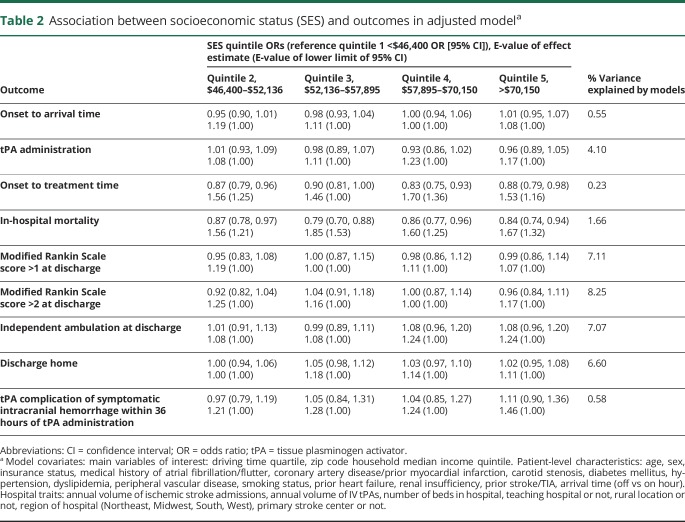
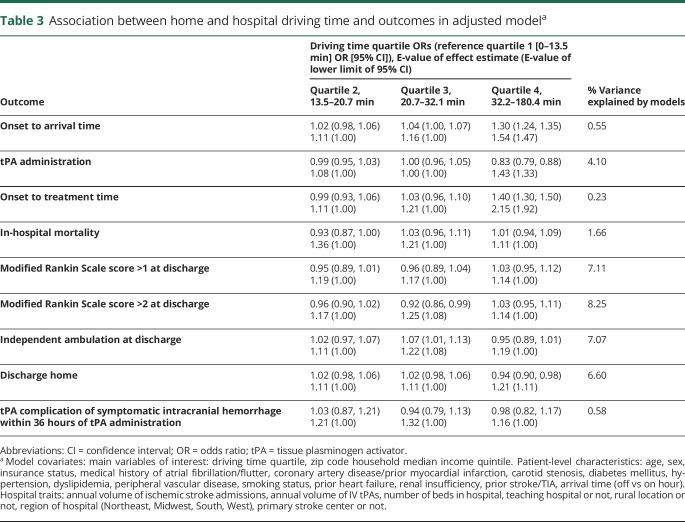
The association between SES and the outcomes as well as driving time and the outcomes are shown in tables 2 and 3. There was no association between SES quintile and the primary outcomes of OTA (p = 0.31) or tPA administration (p = 0.47). However, there was an overall association between SES and OTT (p = 0.02) and SES and in-hospital mortality (p = 0.004). As SES increased, OTT decreased and in-hospital mortality decreased (table 2). There was no association between SES quintile and mRS >1 (p = 0.9408), mRS >2 (p = 0.4805), ambulation at discharge (p = 0.48), discharge home (p = 0.5191), or tPA complication of sICH within 36 hours (p = 0.83).
Table 2.
Association between socioeconomic status (SES) and outcomes in adjusted modela
Table 3.
Association between home and hospital driving time and outcomes in adjusted modela
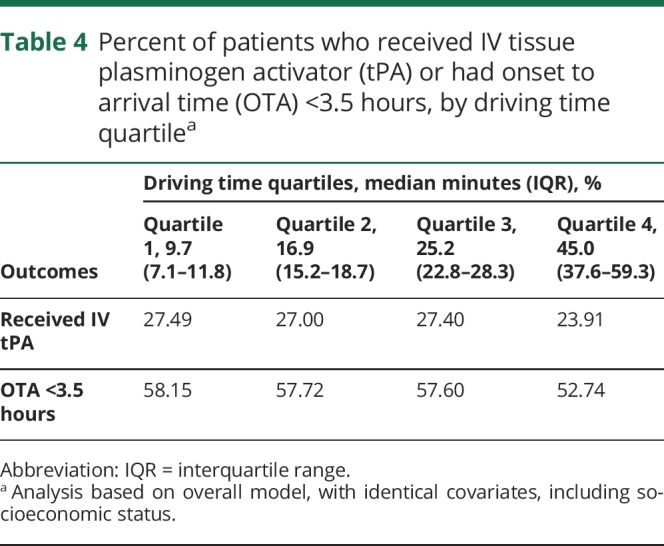
There was an overall association between driving time and the primary outcomes of OTA (p < 0.001) and tPA administration (p < 0.001). In the shortest driving time (median minutes [IQR]) quartile (9.7 [7.1–11.8]), 58.2% of patients had an OTA under 3.5 hours, while in the longest driving time quartile (45.0 [37.6–59.3]), the percent decreased modestly to 52.7% (odds ratio [OR] 1.30, 95% confidence interval [CI] 1.24–1.35). The percent of patients who received tPA decreased from 27.5% in quartile 1 to 23.9% in quartile 4 (OR 0.83, 95% CI 0.79–0.88) (table 4).
Table 4.
Percent of patients who received IV tissue plasminogen activator (tPA) or had onset to arrival time (OTA) <3.5 hours, by driving time quartilea
There was also an association between driving time and OTT (p < 0.001), and as driving time increased, OTT increased (quartile 4 OR 1.40, 95% CI 1.30–1.50, compared to quartile 1). There were also associations between driving time and discharge to home (p < 0.0001), ambulation at discharge (p = 0.0003), and mRS >2 (p = 0.0086); however, there was no clear pattern for these associations (table 3). The association of driving time with in-hospital mortality was borderline (p = 0.0517). There was no association between driving time and tPA complication of sICH within 36 hours.
There was no interaction between the SES × driving time interaction term and OTA (p = 0.11) or tPA administration (p = 0.61) and any of the primary or secondary outcomes. However, there was a small association between SES quintile and driving time quartile, such that lower SES was correlated with longer driving times (r = −0.04, p = 0.0029).
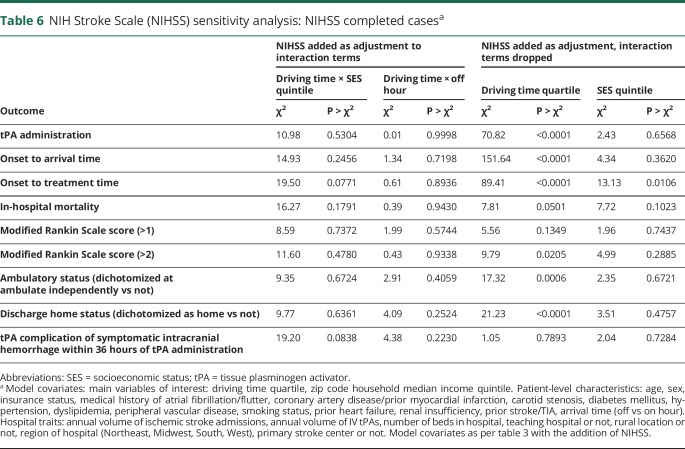
There was no interaction between off hours and driving time for OTA (p = 0.34), tPA administration (p = 0.97), or any of the secondary outcomes (table 5). Compared with patients with NIHSS recorded, those without NIHSS recorded were less likely to come from an academic hospital (54.3% vs 58%, p = 0.0007), were more likely to come from a rural hospital (7.5% vs 3.6%, p < 0.0001), and had longer OTA times (299 vs 149 minutes, p < 0.0001) (table e-1, doi.org/10.5061/dryad.60j13b7). The sensitivity analysis adjusting for NIHSS demonstrated similar results to the primary analysis, with significant associations between driving time and all outcomes other than in-hospital mortality, mRS, and tPA complications (table 6).
Table 5.
“On-hour” vs “off-hour” sensitivity analysis: Interaction between off hour × driving time quartile interaction term and outcomes
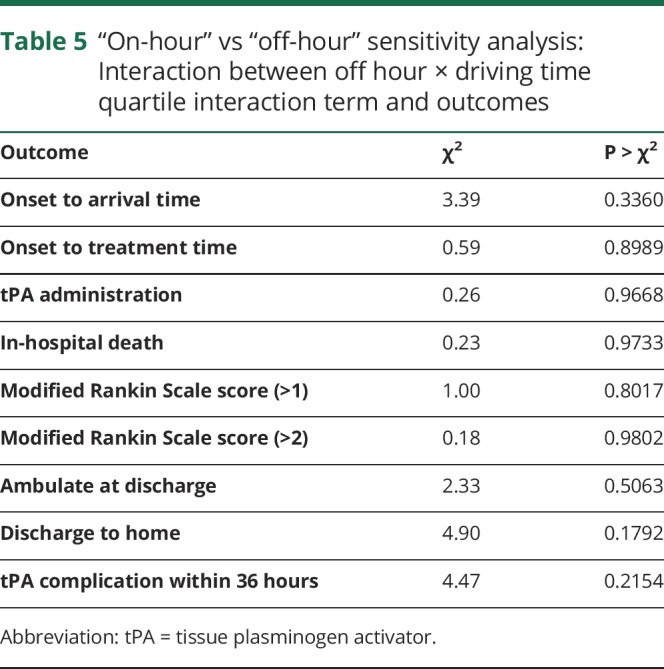
Table 6.
NIH Stroke Scale (NIHSS) sensitivity analysis: NIHSS completed casesa
Discussion
For this nationally representative cohort of patients hospitalized with acute ischemic stroke, we sought to determine whether patients with low SES and patients with longer driving times have longer OTA or lower tPA administration. Lower SES was not associated with longer OTA or lower rates of tPA administration, but was associated with longer OTT and higher in-hospital mortality. Longer driving times were associated with decreased odds of tPA administration, longer OTA, and longer OTT. Although low SES patients had slightly longer driving times than higher SES patients, SES did not modify the association between driving time and OTA or tPA administration.
Our findings support prior literature on the association of SES and timely treatment by demonstrating that low SES was significantly associated with greater OTT and in-hospital mortality.5,21–23 Acute stroke treatment delays among low SES populations may be due to factors such as delayed EMS response, or lower levels of education leading to delayed recognition of stroke symptoms, lower awareness of treatment options, and subsequent delayed EMS activation.21–23
Studies of driving time and timely stroke treatment have had mixed results. While an analysis of data from a single hospital in St. Louis found greater patient distance from the hospital to be associated with a lower likelihood of tPA administration, they did not find distance to be associated with arrival time.24 However, numerous other studies, including a national study in Japan by Kunisawa et al.,25 did not find an association between patient distance and arrival time or tPA treatment.25–28 Our study adds evidence that longer driving times are associated with reduced tPA administration, longer OTA, and worse patient outcomes.
Patient arrival delays could be attributed to 2 processes: delays in EMS activation and delays in EMS transport. Our analysis, in light of existing literature, suggests that patients residing in a low SES zip code may have delays in EMS activation. In addition, driving time contributes to longer EMS transport times. Our data provide direction for further research addressing these 2 separate processes.
Our analysis demonstrates an association between SES and OTT, despite being limited to patients brought in by EMS. This suggests that delayed OTT among low SES patients can be attributed to either delayed ambulance activation or delayed transport time. We do not have information on when EMS was activated, and therefore cannot quantify the role of either delayed EMS activation or transport on delayed OTT. Prior research has demonstrated little difference in transport time in ischemic stroke for patients of different SES.29 Thus, the delayed OTT among low SES patients can more likely be attributed to delayed EMS activation.
There have been a number of public education campaigns to increase recognition of stroke symptoms and rapid activation of EMS services. However, roughly one third of people in the United States are unaware of major stroke symptoms, with lower awareness and EMS use among black, Asian, and Hispanic populations.30–32 Future research should determine how SES leads to delayed OTT and the types of education campaigns that would most effectively address this process.
The rate of tPA administration decreased modestly among the first 3 driving time quartiles, but decreased sharply among the fourth, longest driving time quartile. Similarly, the percentage of patients arriving within 3.5 hours decreased sharply in the quartile of patients with the longest driving times (table 4). Given these findings, policymakers should prioritize interventions that reduce transport time among this segment of the population that lives farthest from the hospital.
There are a number of strategies that can be utilized to reduce transport time or to expand access to facilities that can offer tPA treatment. There are efforts to reduce the on-scene time of EMS and to expand the availability of acute stroke ready hospitals and primary and comprehensive stroke centers.30,33 There is increasing use of telestroke services in lower population density regions and a strategy of transferring of patients from tPA-capable hospitals to hospitals with a higher level of care (drip and ship).33 More recently, there has been use of ambulances with stroke diagnostic and treatment capabilities (mobile stroke units).34 However, further research is needed to determine which policies most effectively improve timely stroke treatment for those patients who live farthest from the hospital.
Limitations
There are a number of limitations to our analysis. First, driving time was not measured directly, but rather was estimated using Google Maps. Second, the calculation of driving time was based on Google Maps traffic data available at the date and time of the analysis, not the date and time of the stroke. In addition, our calculations do not account for the fact that ambulances can bypass traffic and go faster than the speed limit. We did not have access to data on the speed of ambulances relative to non-EMS transit. In addition, we would not be able to apply any common adjustments to the calculated transit speeds, as the difference between EMS and non-EMS ground transportation likely differs between rural and urban settings, and regions with more or less traffic congestion. However, despite these limitations, the use of driving time is an improvement from using home to hospital linear distance, as the driving time calculation accounts for different traffic patterns of different regions. To account for the different transport speed of patients who were brought in by helicopter EMS, our analysis was limited to patients brought in by ground EMS. Third, we used patient home zip code as a proxy for the location of stroke onset. However, people are often away from home when their stroke occurs, and we did not have data for the location of stroke onset. To account for this, we performed a sensitivity analysis of strokes that occurred at times when patients were more and less likely to be at home, such as daytime vs nighttime and weekends, and found no significant differences. Fourth, we used the zip code median household income as a proxy for each patient's SES; however, this may not accurately represent each patient's SES. Fifth, excluding patients with tPA contraindications could have introduced a selection bias as tPA contraindications may be inadequately documented, especially in patients with longer driving times. Sixth, our study was limited to patients brought in by EMS. However, only about 50%–60% of stroke patients are brought in by EMS.30,35 Seventh, given our lack of access to data from non-GWTG hospitals, we are unable to determine the representativeness of GWTG hospitals with regard to the driving times for patients living in low SES zip codes. However, the study included 1,489 GWTG hospitals across the 48 states, and we did not find a significant interaction between driving time and SES. Next, it is possible that OTT and OTA could be longer for patients living in zip codes where EMS programs were in place to route patients with possible large vessel occlusions to centers capable of mechanical thrombectomy. Even though our study data are recent (2015–2017), this limitation is largely theoretical, as many EMS agencies across the country likely did not have functional bypass polices in place. We do not have data regarding these zip code level EMS system protocols during the study period. In addition, GWTG-Stroke does not have data on when 911 was called, and we therefore cannot determine what proportion of OTA delay is due to delayed recognition of stroke symptoms or reluctance to call 911 vs delays in EMS response and transit. Finally, the associations between SES, driving time, and the outcomes could be explained by unmeasured confounders. However, the E-values demonstrate that these confounders would need to have moderately strong associations with SES, driving time, and the outcomes to explain the associations, and only a small portion of the variance of the outcomes was explained by the models.
Among patients with acute ischemic stroke, lower SES was associated with increased OTT and greater in-hospital mortality. Longer driving time was associated with decreased odds of tPA administration, longer OTA, and longer OTT. Although there was a small association between high SES and shorter driving times, SES did not modify the association between driving time and tPA administration or OTA. These findings provide evidence that SES and driving time to the hospital independently impede timely stroke treatment. Targeted interventions are needed to reduce EMS activation time for patients of low SES and transport time for patients who live far from tPA-capable hospitals.
Glossary
- API
Application Programming Interface
- CI
confidence interval
- DCRI
Duke Clinical Research Institute
- EMS
emergency medical services
- GEE
generalized estimating equation
- GWTG-Stroke
Get With The Guidelines–Stroke
- IA
intra-arterial
- IQR
interquartile range
- mRS
modified Rankin Scale
- NIHSS
NIH Stroke Scale
- OR
odds ratio
- OTA
onset to arrival time
- OTT
onset to treatment time
- SES
socioeconomic status
- sICH
symptomatic intracranial hemorrhage
- tPA
tissue plasminogen activator
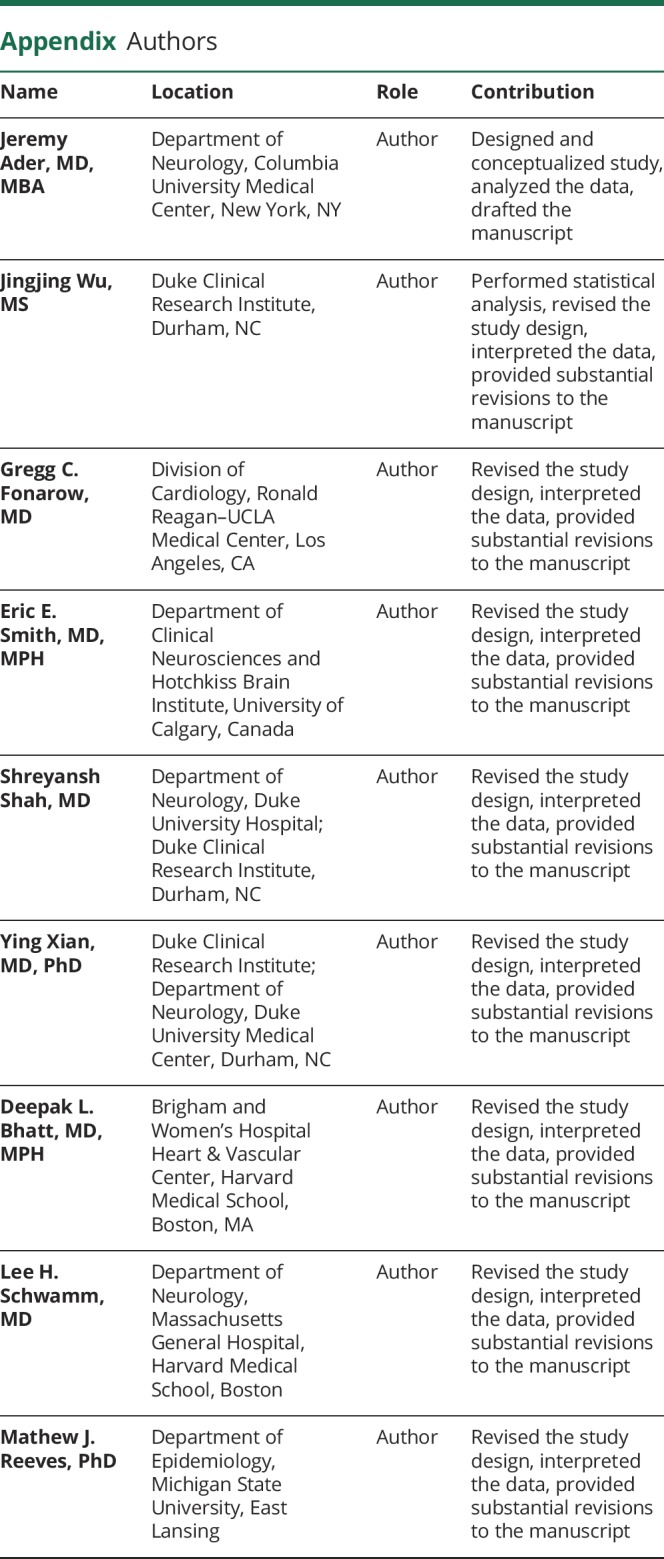
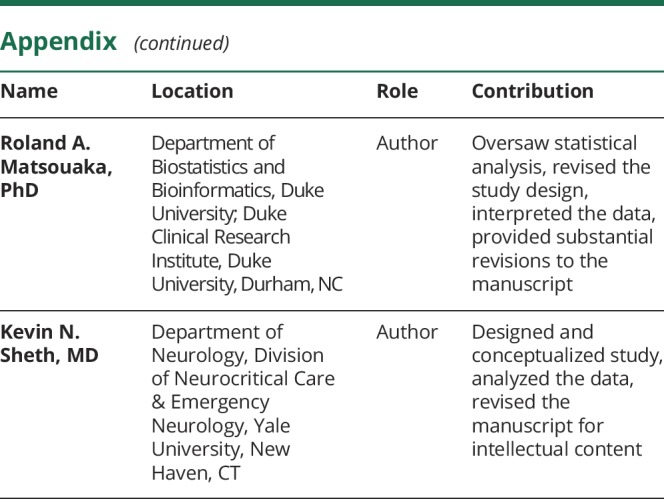
Appendix. Authors
Study funding
J. Ader discloses funding for this project from the NIH National Heart, Lung, and Blood Institute Medical Student Research Fellowship. The content of this article is solely the responsibility of the authors and does not necessarily represent the official views of the National Heart, Lung, and Blood Institute or the NIH under award T35HL007649.
Disclosure
J. Ader discloses funding for this project from the NIH National Heart, Lung, and Blood Institute Medical Student Research Fellowship. The content of this paper is solely the responsibility of the authors and does not necessarily represent the official views of the National Heart, Lung, and Blood Institute or the NIH under award number T35HL007649. J. Wu reports no disclosures relevant to the manuscript. G. Fonarow discloses research support from the Patient Centered Outcome Research Institute, steering committee Get With The Guidelines, and employee of UC Regents, which have a patent on an endovascular device. E. Smith is a member of the Steering Committee of Get With The Guidelines (unpaid). S. Shah and Y. Xian report no disclosures relevant to the manuscript. D. Bhatt discloses the following relationships: Advisory Board: Cardax, Elsevier Practice Update Cardiology, Medscape Cardiology, Regado Biosciences; Board of Directors: Boston VA Research Institute, Society of Cardiovascular Patient Care, TobeSoft; Chair: American Heart Association Quality Oversight Committee; Data Monitoring Committees: Baim Institute for Clinical Research (formerly Harvard Clinical Research Institute, for the PORTICO trial, funded by St. Jude Medical, now Abbott), Cleveland Clinic, Duke Clinical Research Institute, Mayo Clinic, Mount Sinai School of Medicine (for the ENVISAGE trial, funded by Daiichi Sankyo), Population Health Research Institute; Honoraria: American College of Cardiology (Senior Associate Editor, Clinical Trials and News, ACC.org; Vice-Chair, ACC Accreditation Committee), Baim Institute for Clinical Research (formerly Harvard Clinical Research Institute; RE-DUAL PCI clinical trial steering committee funded by Boehringer Ingelheim), Belvoir Publications (Editor-in-Chief, Harvard Heart Letter), Duke Clinical Research Institute (clinical trial steering committees), HMP Global (Editor-in-Chief, Journal of Invasive Cardiology), Journal of the American College of Cardiology (Guest Editor; Associate Editor), Population Health Research Institute (for the COMPASS operations committee, publications committee, steering committee, and USA national co-leader, funded by Bayer), Slack Publications (Chief Medical Editor, Cardiology Today's Intervention), Society of Cardiovascular Patient Care (Secretary/Treasurer), WebMD (CME steering committees); other: Clinical Cardiology (Deputy Editor), NCDR-ACTION Registry Steering Committee (Chair), VA CART Research and Publications Committee (Chair); research funding: Abbott, Amarin, Amgen, AstraZeneca, Bayer, Boehringer Ingelheim, Bristol-Myers Squibb, Chiesi, Eisai, Ethicon, Forest Laboratories, Idorsia, Ironwood, Ischemix, Lilly, Medtronic, PhaseBio, Pfizer, Regeneron, Roche, Sanofi Aventis, Synaptic, The Medicines Company; royalties: Elsevier (Editor, Cardiovascular Intervention: A Companion to Braunwald's Heart Disease); site coinvestigator: Biotronik, Boston Scientific, St. Jude Medical (now Abbott), Svelte; trustee: American College of Cardiology; unfunded research: FlowCo, Merck, Novo Nordisk, PLx Pharma, Takeda. L. Schwamm is serving as the chair of the American Heart Association/American Stroke Association Get With The Guidelines–Stroke clinical work group and Healthcare Accreditation Science Committee; stroke systems consultant to the Massachusetts Department of Public Health; and scientific consultant regarding trial design and conduct to Penumbra, Medtronic, and Genentech. M. Reeves and R. Matsouaka report no disclosures relevant to the manuscript. K. Sheth discloses the following: NINDS StrokeNet, U24NS107215, NINDS NeuroNEXT U24NS107136, NIH RO1NR018335, U01NS106513, AHA 17CSA33550004, Co-Global Lead, CHARM Trial, Biogen, Hyperfine, Alva Health. Go to Neurology.org/N for full disclosures.
References
- 1.Schwamm LH, Ali SF, Reeves MJ, et al. Temporal trends in patient characteristics and treatment with intravenous thrombolysis among acute ischemic stroke patients at Get With the Guidelines–Stroke hospitals. Circ Cardiovasc Qual Outcomes 2013;6:543–549. [DOI] [PubMed] [Google Scholar]
- 2.Nogueira RG, Jadhav AP, Haussen DC, et al. Thrombectomy 6 to 24 hours after stroke with a mismatch between deficit and infarct. N Engl J Med 2018;378:11–21. [DOI] [PubMed] [Google Scholar]
- 3.Albers GW, Marks MP, Kemp S, et al. Thrombectomy for stroke at 6 to 16 hours with selection by perfusion imaging. N Engl J Med 2018;378:708–718. [DOI] [PMC free article] [PubMed] [Google Scholar]
- 4.Saver JL, Fonarow GC, Smith EE, et al. Time to treatment with intravenous tissue plasminogen activator and outcome from acute ischemic stroke. JAMA 2013;309:2480–2488. [DOI] [PubMed] [Google Scholar]
- 5.Agarwal S, Menon V, Jaber WA. Outcomes after acute ischemic stroke in the United States: does residential zip code matter? J Am Heart Assoc 2015;4:e001629. [DOI] [PMC free article] [PubMed] [Google Scholar]
- 6.Fonarow GC, Reeves MJ, Smith EE, et al. Characteristics, performance measures, and in-hospital outcomes of the first one million stroke and transient ischemic attack admissions in Get With The Guidelines-Stroke. Circ Cardiovasc Qual Outcomes 2010;3:291–302. [DOI] [PubMed] [Google Scholar]
- 7.Jarman MP, Curriero FC, Haut ER, Pollack Porter K, Castillo RC. Associations of distance to trauma care, community income, and neighborhood median age with rates of injury mortality. JAMA Surg 2018;153:535–543. [DOI] [PMC free article] [PubMed] [Google Scholar]
- 8.Adeoye O, Albright KC, Carr BG, et al. Geographic access to acute stroke care in the United States. Stroke 2014;45:3019–3024. [DOI] [PMC free article] [PubMed] [Google Scholar]
- 9.Kleindorfer D, Xu Y, Moomaw CJ, Khatri P, Adeoye O, Hornung R. US geographic distribution of rt-PA utilization by hospital for acute ischemic stroke. Stroke 2009;40:3580–3584. [DOI] [PubMed] [Google Scholar]
- 10.Scott PA, Temovsky CJ, Lawrence K, Gudaitis E, Lowell MJ. Analysis of Canadian population with potential geographic access to intravenous thrombolysis for acute ischemic stroke. Stroke 1998;29:2304–2310. [DOI] [PubMed] [Google Scholar]
- 11.Hong ES, Kim SH, Kim WY, Ahn R, Hong JS. Factors associated with prehospital delay in acute stroke. Emerg Med J 2011;28:790–793. [DOI] [PubMed] [Google Scholar]
- 12.Hare TS, Barcus HR. Geographical accessibility and Kentucky's heart-related hospital services. Appl Geogr 2007;27:181–205. [Google Scholar]
- 13.Cumbler E, Wald H, Bhatt DL, et al. Quality of care and outcomes for in-hospital ischemic stroke: findings from the National Get With the Guidelines-Stroke. Stroke 2014;45:231–238. [DOI] [PubMed] [Google Scholar]
- 14.Xian Y, Fonarow GC, Reeves MJ, et al. Data quality in the American Heart Association Get With The Guidelines-Stroke (GWTG-Stroke): results from a national data validation audit. Am Heart J 2012;163:392–398. [DOI] [PubMed] [Google Scholar]
- 15.Schwamm LH, Fonarow GC, Reeves MJ, et al. Get With The Guidelines–Stroke is associated with sustained improvement in care for patients hospitalized with acute stroke or transient ischemic attack. Circulation 2009;119:107–115. [DOI] [PubMed] [Google Scholar]
- 16.US Department of Health & Human Services. Health resources & services administration data warehouse. 2017. Available at: datawarehouse.hrsa.gov/. Accessed September 6, 2017.
- 17.SAS Institute Inc. The GEOCODE procedure. 2018. Available at: http://support.sas.com/documentation/cdl/en/graphref/63022/HTML/default/viewer.htm#overview-geocode.htm. Accessed September 6, 2017.
- 18.Google Maps Platform. Directions API. 2018. Available at: https://developers.google.com/maps/documentation/directions/intro. Accessed September 6, 2017.
- 19.VanderWeele TJ, Ding P. Sensitivity analysis in observational research: introducing the E-value. Ann Intern Med 2017;167:268–274. [DOI] [PubMed] [Google Scholar]
- 20.Mittlböck M, Schemper M. Explained variation for logistic regression. Stat Med 1996;15:1987–1997. [DOI] [PubMed] [Google Scholar]
- 21.Anderson BE, Rafferty AP, Lyon-Callo S, Fussman C, Reeves MJ. Knowledge of tissue plasminogen activator for acute stroke among Michigan adults. Stroke 2009;40:2564–2567. [DOI] [PubMed] [Google Scholar]
- 22.Greenlund KJ, Neff LJ, Zheng ZJ, et al. Low public recognition of major stroke symptoms. Am J Prev Med 2003;25:315–319. [DOI] [PubMed] [Google Scholar]
- 23.Pancioli AM, Broderick J, Kothari R, et al. Public perception of stroke warning signs and knowledge of potential risk factors. JAMA 1998;279:1288–1292. [DOI] [PubMed] [Google Scholar]
- 24.Acharya AB, Nyirenda JC, Higgs GB, et al. Distance from home to hospital and thrombolytic utilization for acute ischemic stroke. J Stroke Cerebrovasc Dis 2011;20:295–301. [DOI] [PubMed] [Google Scholar]
- 25.Kunisawa S, Morishima T, Ukawa N, et al. Association of geographical factors with administration of tissue plasminogen activator for acute ischemic stroke. J Am Heart Assoc 2013;2:e000336. [DOI] [PMC free article] [PubMed] [Google Scholar]
- 26.Wester P, Rådberg J, Lundgren B, Peltonen M. Factors associated with delayed admission to hospital and in-hospital delays in acute stroke and TIA: a prospective, multicenter study. Seek-Medical-Attention-in-Time Study Group. Stroke 1999;30:40–48. [DOI] [PubMed] [Google Scholar]
- 27.Derex L, Adeleine P, Nighoghossian N, Honnorat J, Trouillas P. Factors influencing early admission in a French stroke unit. Stroke 2002;33:153–159. [DOI] [PubMed] [Google Scholar]
- 28.Tanaka Y, Nakajima M, Hirano T, Uchino M. Factors influencing pre-hospital delay after ischemic stroke and transient ischemic attack. Intern Med 2009;48:1739–1744. [DOI] [PubMed] [Google Scholar]
- 29.Kleindorfer DO, Lindsell CJ, Broderick JP, et al. Community socioeconomic status and prehospital times in acute stroke and transient ischemic attack: do poorer patients have longer delays from 911 call to the emergency department? Stroke 2006;37:1508–1513. [DOI] [PubMed] [Google Scholar]
- 30.Powers WJ, Rabinstein AA, Ackerson T, et al. 2018 guidelines for the early management of patients with acute ischemic stroke: a guideline for healthcare professionals from the American Heart Association/American Stroke Association. Stroke 2018;49:e46–e110. [DOI] [PubMed] [Google Scholar]
- 31.Ojike N, Ravenell J, Seixas A, et al. Racial disparity in stroke awareness in the US: an analysis of the 2014 National Health Interview Survey. J Neurol Neurophysiol 2016;7:365. [DOI] [PMC free article] [PubMed] [Google Scholar]
- 32.Ekundayo OJ, Saver JL, Fonarow GC, et al. Patterns of emergency medical services use and its association with timely stroke treatment: findings from Get With the Guidelines–Stroke. Stroke 2013;6:262–269. [DOI] [PubMed] [Google Scholar]
- 33.Alberts MJ, Wechsler LR, Jensen MEL, et al. Formation and function of acute stroke–ready hospitals within a stroke system of care recommendations from the brain attack coalition. Stroke 2013;44:3382–3393. [DOI] [PubMed] [Google Scholar]
- 34.Belt GH, Felberg RA, Rubin J, Halperin JJ. In-transit telemedicine speeds ischemic stroke treatment: preliminary results. Stroke 2016;47:2413–2415. [DOI] [PubMed] [Google Scholar]
- 35.Mochari-Greenberger H, Xian Y, Hellkamp AS, et al. Racial/ethnic and sex differences in emergency medical services transport among hospitalized US stroke patients: analysis of the National Get With the Guidelines–Stroke Registry. J Am Heart Assoc 2015;4:e002099. [DOI] [PMC free article] [PubMed] [Google Scholar]
Associated Data
This section collects any data citations, data availability statements, or supplementary materials included in this article.
Data Availability Statement
Data were collected by the American Heart Association (the steward of the data according to contracts between the American Heart Association and participating hospitals), and are stored securely at the Duke Clinical Research Institute (DCRI). Given that data were collected for clinical care and quality improvement, rather than primarily for research, data sharing agreements require an application process in order for other researchers to access the data. Interested researchers can submit proposals to utilize GWTG for research purposes, including for validation purposes. Proposals can be submitted at heart.org/en/professional/quality-improvement/get-with-the-guidelines/get-with-the-guidelines-stroke/get-with-the-guidelines-stroke-overview. Additional information regarding the statistical analysis plan and analytic code may also be available from DCRI upon request.


