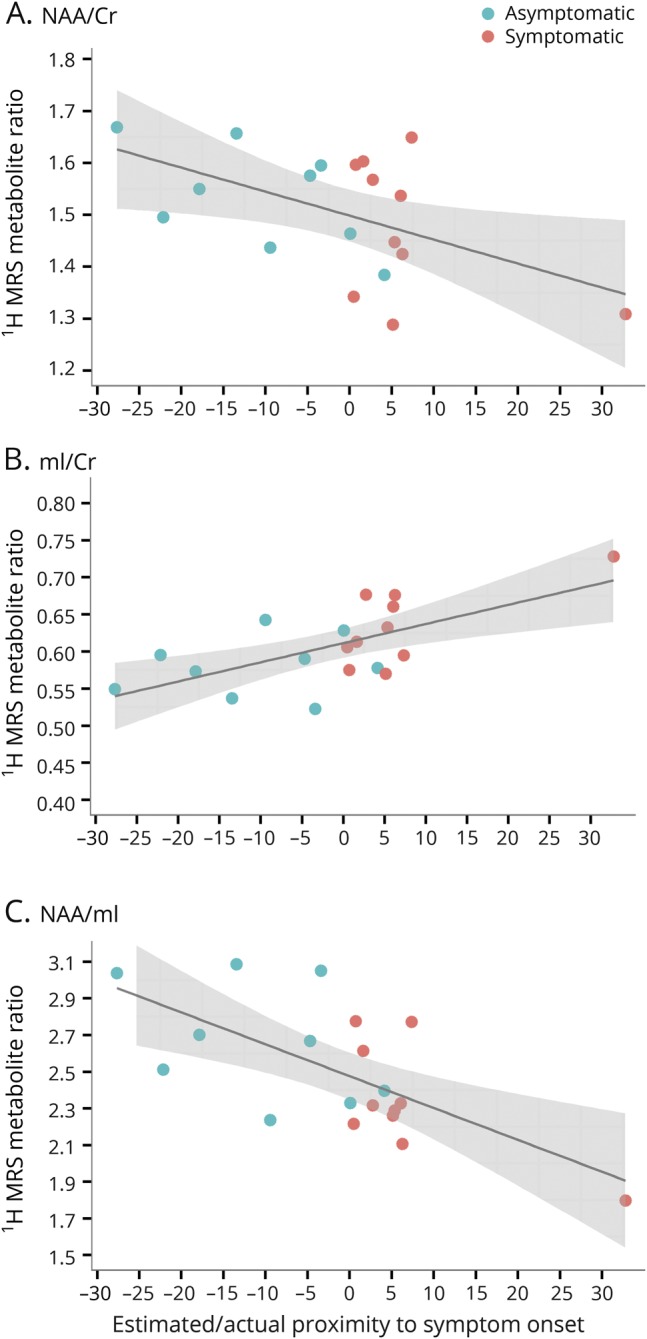
Figure 3. Plots of frontal lobe 1H MRS metabolite ratios and estimated or actual proximity to symptom onset.

In the horizontal axis, 0 indicates the estimated age at symptom onset for asymptomatic microtubule-associated protein tau (MAPT) mutation carriers based on the median age at symptom onset in symptomatic MAPT mutation carriers from the same family; 0 indicates the age at actual symptom onset in symptomatic MAPT mutation carriers. (A) N-acetylaspartate (NAA)/creatine (Cr), (B) myo-inositol (mI/Cr), and (C) NAA/mI.
