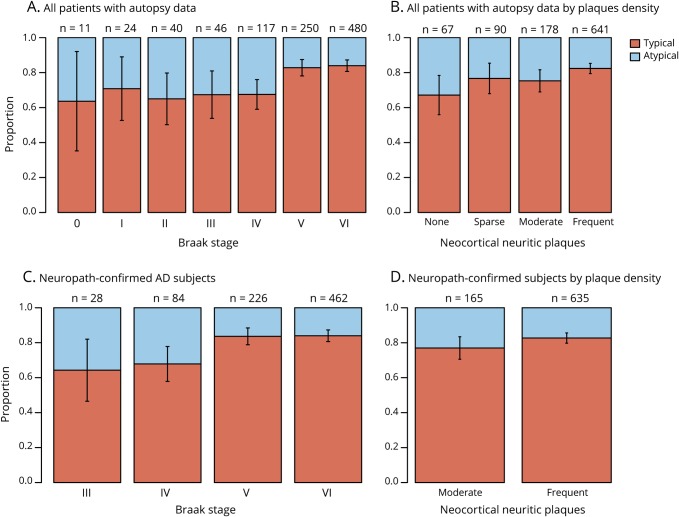
Figure 2. Proportion of typical and atypical participants by Braak and CERAD rating.
Distribution of cognitive subtype by Braak stage and Consortium to Establish a Registry for Alzheimer’s Disease (CERAD) plaque density rating (A and B) for all sample 1 participants with autopsy (n = 976) and (C and D) restricted to those with pathologically confirmed Alzheimer disease (AD) (n = 800). Number over each bar is the sample size for that stage/level. Classification was based on clustering results of sample 1.

