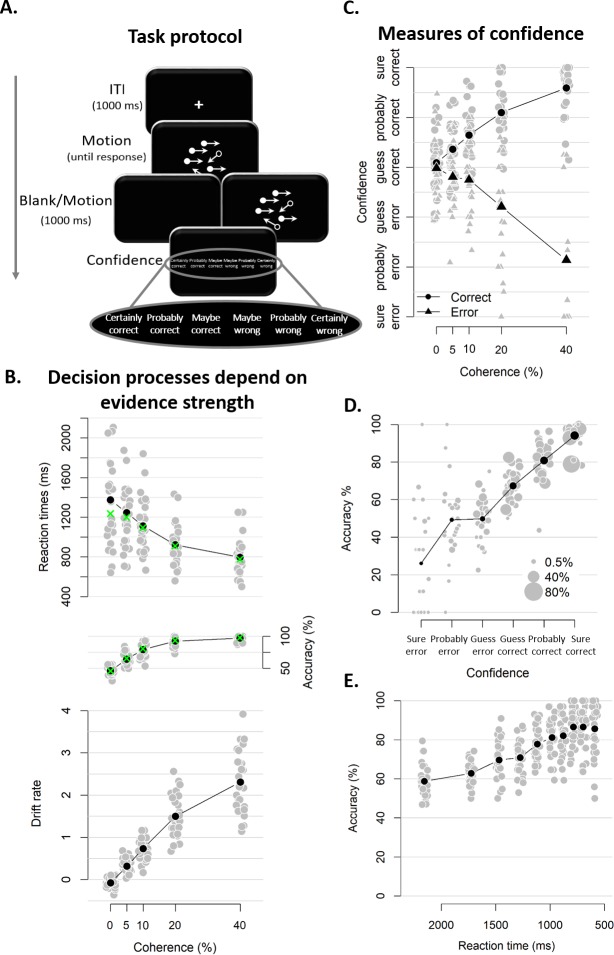
Figure 2. Experimental task and results from Experiment 1.
(A) Sequence of events in a trial from Experiment 1. Participants decided, as fast and accurately as possible, whether the majority of dots were moving left or right. After their response and a 1 s blank or 1 s of continued motion, they indicated the degree of confidence in their decision using a six-point confidence scale (ranging from certainly correct to certainly wrong). (B) Mean reaction time on correct trials (top), accuracy (middle) and estimated mean drift rate (bottom) as a function of coherence. Green crosses show fits from the DDM. (C) Confidence as a function of coherence level, separately for corrects and errors. (D) Accuracy as a function of decision confidence (dot size reflects percentage of trials per confidence label, separately for each participant). (E) Accuracy as a function of reaction time. Data are pooled across the blank and the continued motion condition. Gray dots: individual participants; black dots: group averages.
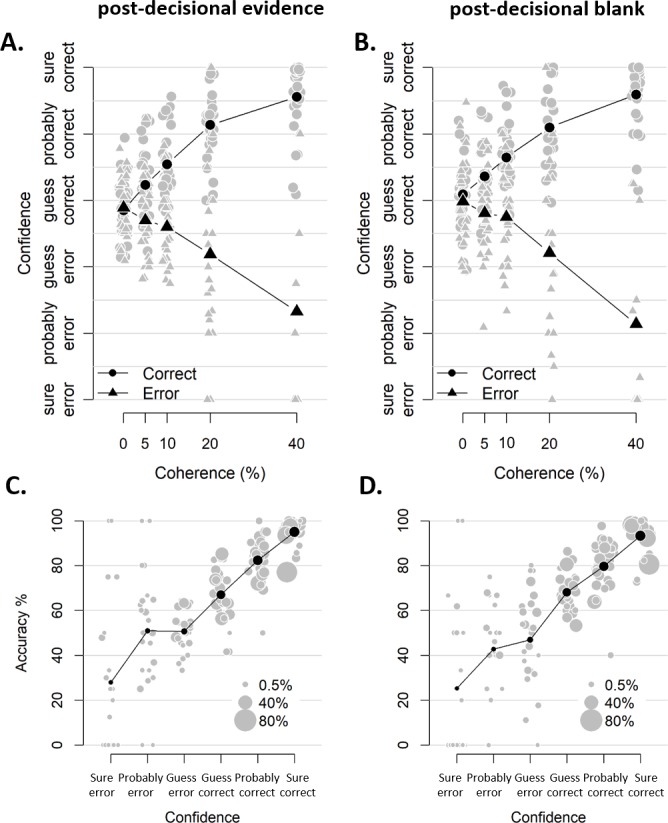
Figure 2—figure supplement 1. Similar confidence judgments for blocks with and without post-decisional evidence.


