Figure 5. Confidence-dependent modulation of decision bounds generalizes to different experimental tasks.
(A) In Experiment 2, participants need to decide as quickly as possible which of two boxes has more dots. In Experiment 3, participants needed to decide, as fast and accurately as possible, whether the average color of the eight elements was more red or blue. (B) Subsequent RT, accuracy and their product as a model-free measure of decision bound as a function of confidence. Green crosses show fits from the DDM. (C) Subsequent decision bounds and subsequent drift rates as a function of confidence. Inset in B shows the distribution of empirical and fitted RTs.
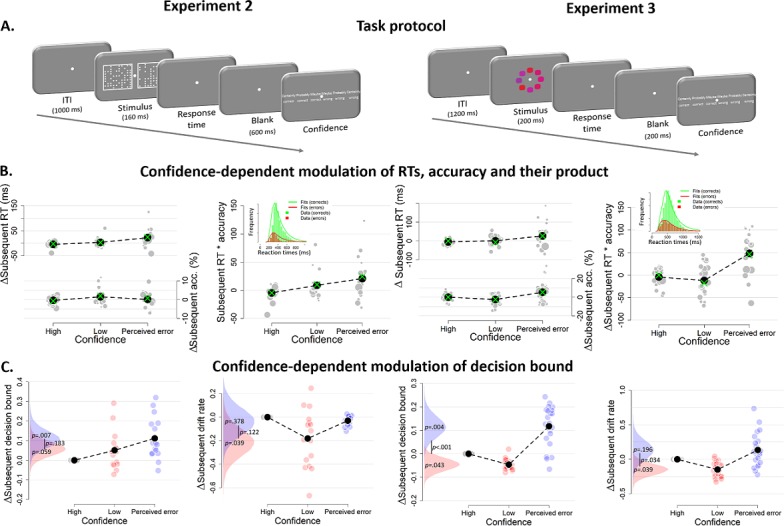
Figure 5—figure supplement 1. Behavioral results of Experiment 2.
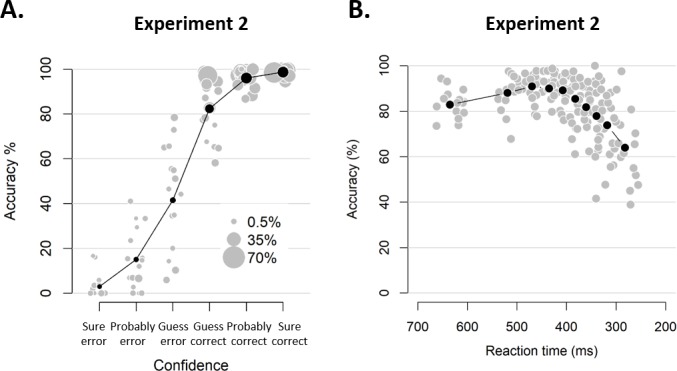
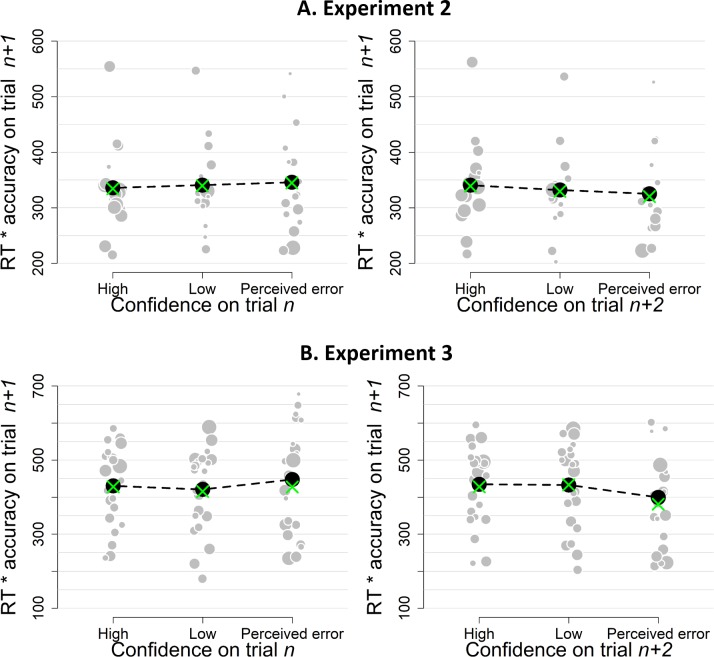
Figure 5—figure supplement 2. Simple effects of confidence on trialn and confidence on trialn+2 on the product of subsequent RTs and accuracy as a model-free measure of decision bound for Experiment 1 (A) and Experiment 2 (B).
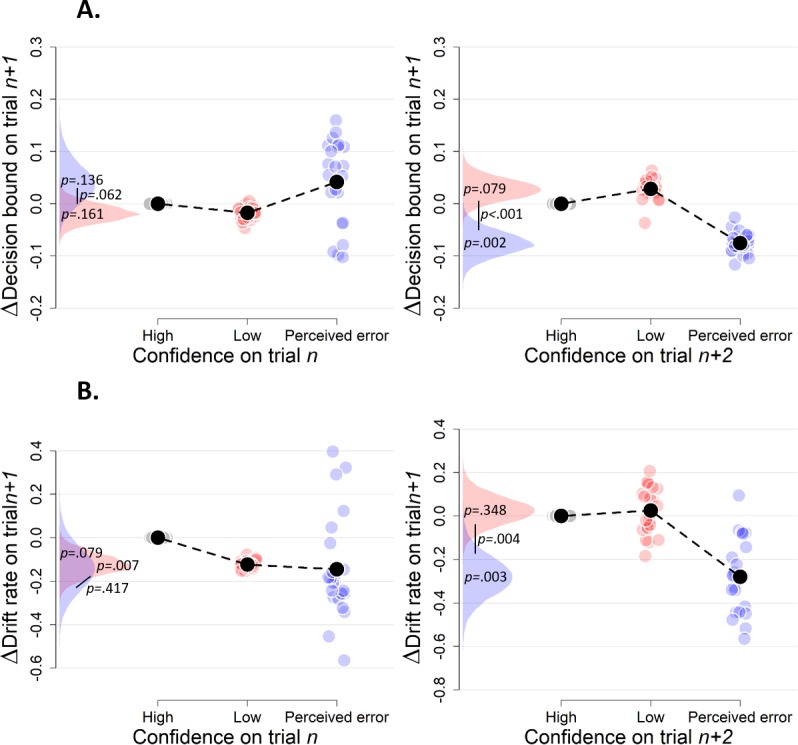
Figure 5—figure supplement 3. Simple effects of confidence on trialn and confidence on trialn+2 on decision bound (A) and drift rate (B) on trialn+1 (Experiment 2).
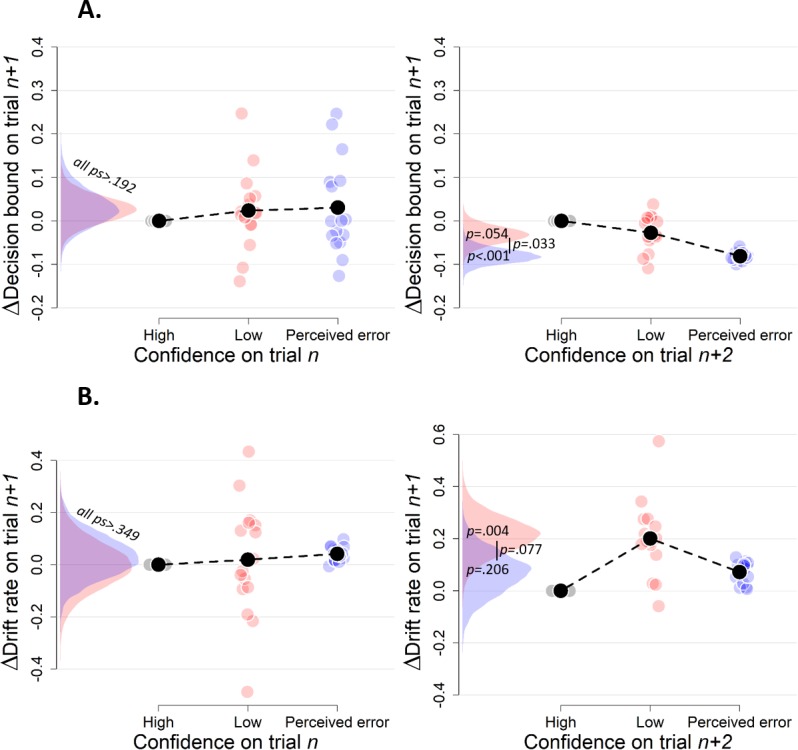
Figure 5—figure supplement 4. Complementary approach controlling for slow fluctuations (Experiment 2).
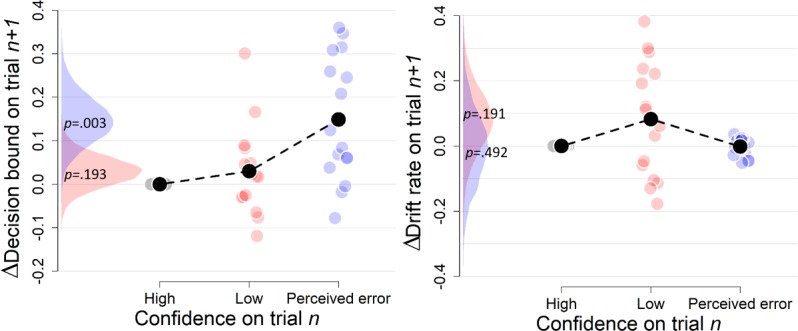
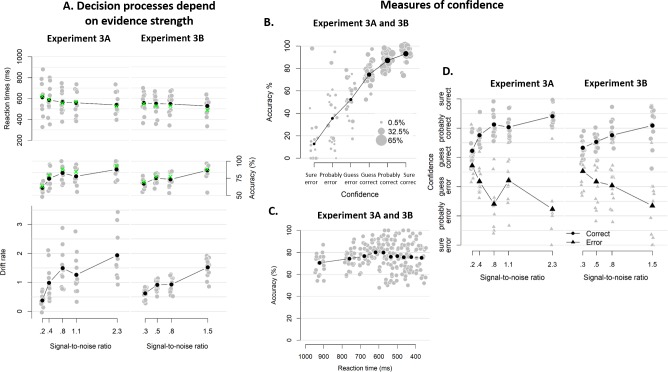
Figure 5—figure supplement 5. Behavioral results of Experiment 3.
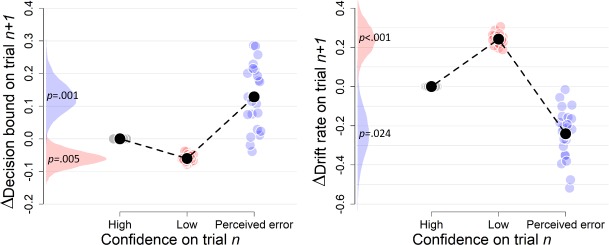
Figure 5—figure supplement 6. Simple effects of confidence on trialn and confidence on trialn+2 on decision bound (A) and drift rate (B) on trialn+1 (Experiment 3).
