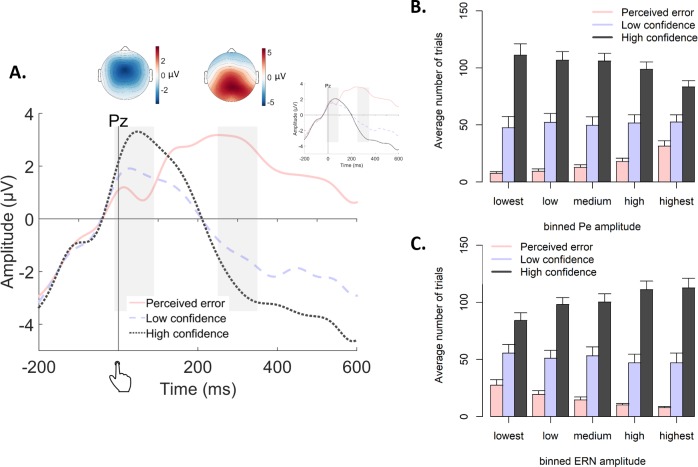
Figure 7. Post-decisional ERPs in Experiment 2.
(A) Response-locked grand-average ERPs at electrode Pz, separately for the three levels of confidence. Gray bars represent the ERN (−10 ms to 90 ms) and the Pe (250 ms to 350 ms). Inset shows the same ERPs after regressing out the ERN. Topographic plots display amplitude differences between high confidence and perceived errors. (B–C) Average number of trials in each bin of the Pe (C) and the ERN (D), separately for the levels of confidence.

