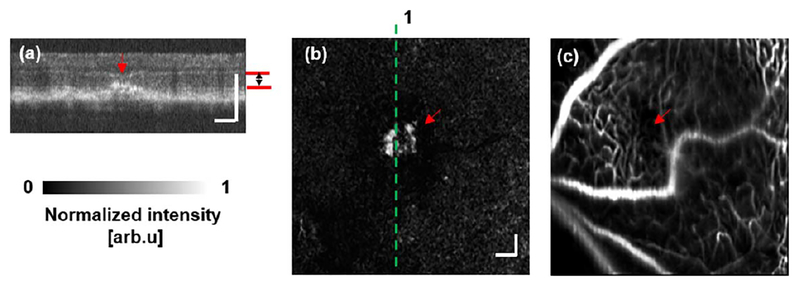
Fig. 5.
Mouse CNV detected by OCTA, but not SLO-FA. (a) Sample OCT cross-sectional B-scan image. (b) CNV imaged by OCTA. The en face OCTA image was extracted from the depth range defined by the red lines in (a). The dashed line 1 indicates the location of the B-scan image shown in (a). (c) SLO-FA showing no detected leakage. Bar: 100 μm.

