. 2019 Aug 27;8:e47084. doi: 10.7554/eLife.47084

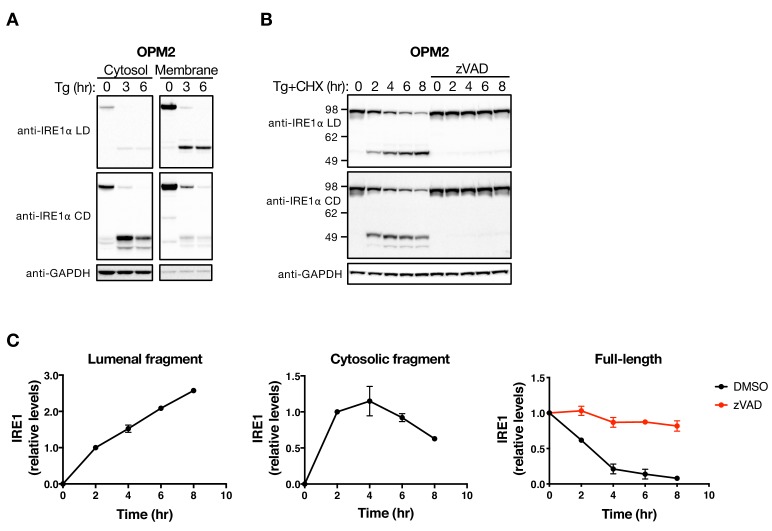
Figure 2. The LD and CD fragments of IRE1 differ in their cellular disposition.

(A) OPM2 cells were treated with 100 nM Tg for the indicated time, subjected to subcellular fractionation, and the cytosol and membrane fractions were analyzed by WB. (B) OPM2 cells were treated with 100 nM Tg to induce ER stress as well as 10 μg/ml CHX to block protein synthesis, in the absence or presence of 20 μM zVAD to block caspase activity. After the indicated incubation time, cells were lysed and analyzed by WB. (C) Levels of the lumenal or cytoplasmic fragments or full-length IRE1 (anti-IRE1α LD) relative to GAPDH were quantitated using ImageJ and plotted as indicated. Data represent mean with standard deviation (SD) from two independent experiments. DMSO vehicle was used as control.

Figure 2.

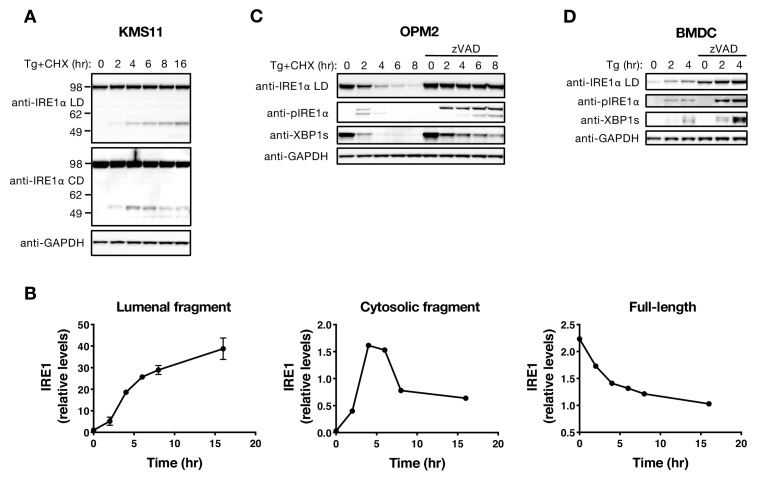
Figure 2—figure supplement 1. The LD and CD fragments of IRE1 differ in their cellular disposition.

Figure 2—figure supplement 1.

(A) KMS11 cells were treated with 100 nM Tg and 10 μg/ml CHX for the indicated time and cells were harvested for protein isolation. Equal amounts of protein were analyzed by WB with the indicated antibodies. (B) Levels of the lumenal or cytoplasmic fragments or full-length IRE1 (anti-IRE1α LD) relative to GAPDH in panel A were quantitated using ImageJ and plotted as indicated. Data represent mean ± SD from two independent experiments. (C) OPM2 cells were treated with 100 nM Tg and 10 μg/ml CHX with or without 20 μM zVAD for the indicated time and cell lysates were analyzed by WB. (D) BMDC were treated with 100 nM Tg with or without 20 μM zVAD and cell lysates were analyzed by WB. WB data represent two or three independent experiments. DMSO vehicle was used as control.