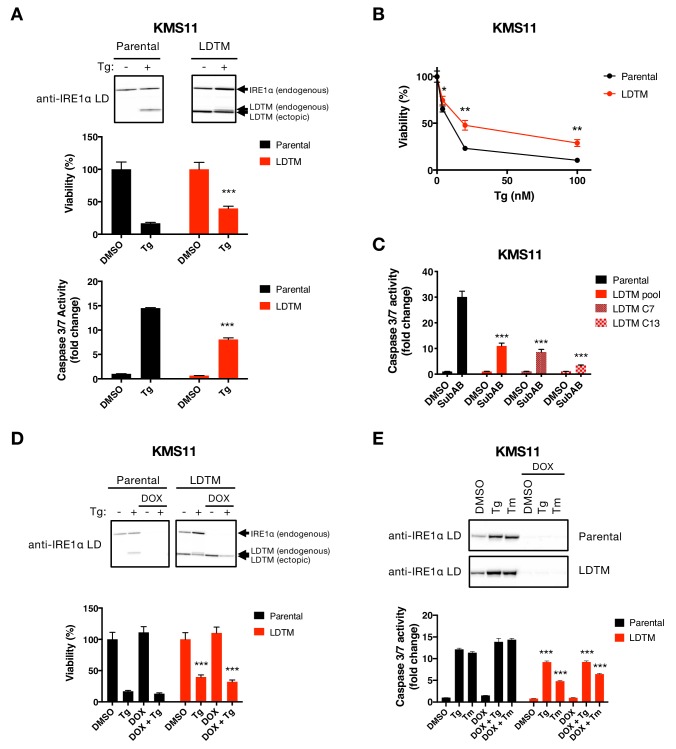
Figure 3. Ectopic expression of IRE1 LDTM attenuates apoptotic caspase activation independent of full-length IRE1.
(A) KMS11 parental cells or cells stably expressing a cDNA plasmid encoding LDTM (1-470) driven by the CMV promoter were treated with DMSO or 100 nM Tg for 24 hr. Cell viability was measured using CellTiter-Glo normalized by the number of cells at seeding (middle panel). The percentage of viable cells is graphed as an average of three biological replicates. Equal amounts of protein from cell lysates were analyzed by WB (top panel) or Caspase-Glo 3/7 assay (bottom panel). WBs are representative of two or more experiments and the graph depicts mean ± SD of three technical replicates. (B) KMS11 cells as in A were treated with different concentrations of Tg for 24 hr and analyzed for viability. The percentage of viable cells is graphed as an average of three biological replicates ± SD. (C) KMS11 parental cells, LDTM expressing KMS11, or single cell clones derived from the LDTM transfected KMS11 pool (C7 or C13) were treated with 0.3 μg/ml SubAB for 3 hr. Equal amounts of protein from cell lysates were analyzed using the Caspase-Glo 3/7 assay. The graph depicts mean luminescence signal normalized to the control ± SD of three technical replicates. (D) KMS11 cells were stably transfected with a DOX-inducible shRNA plasmid targeting IRE1 (Parental). The cells were then stably transfected with a cDNA plasmid encoding LDTM (1-470) driven by the CMV promoter as in A. Parental and ectopic LDTM-expressing cells were treated for 3 days in the absence or presence of 1 μg/ml DOX to induce shRNA-mediated depletion of endogenous IRE1. Cells were then treated with DMSO or 100 nM Tg for 24 hr to induce ER stress and analyzed by WB (top panel) or CellTiterGlo assay (bottom panel). The percentage of viable cells is graphed as an average of three biological replicates ± SD. (E) KMS11 cells expressing DOX-inducible IRE1 shRNA were treated in the absence or presence of 1 μg/ml DOX and then subjected to ER-stress induction with 100 nM Tg or 5 μg/ml Tm for 24 hr. Cells were analyzed by WB (top panel) or Caspase-Glo 3/7 assay (bottom panel). The graph depicts mean luminescence signal normalized to DMSO ± SD of three technical replicates.


