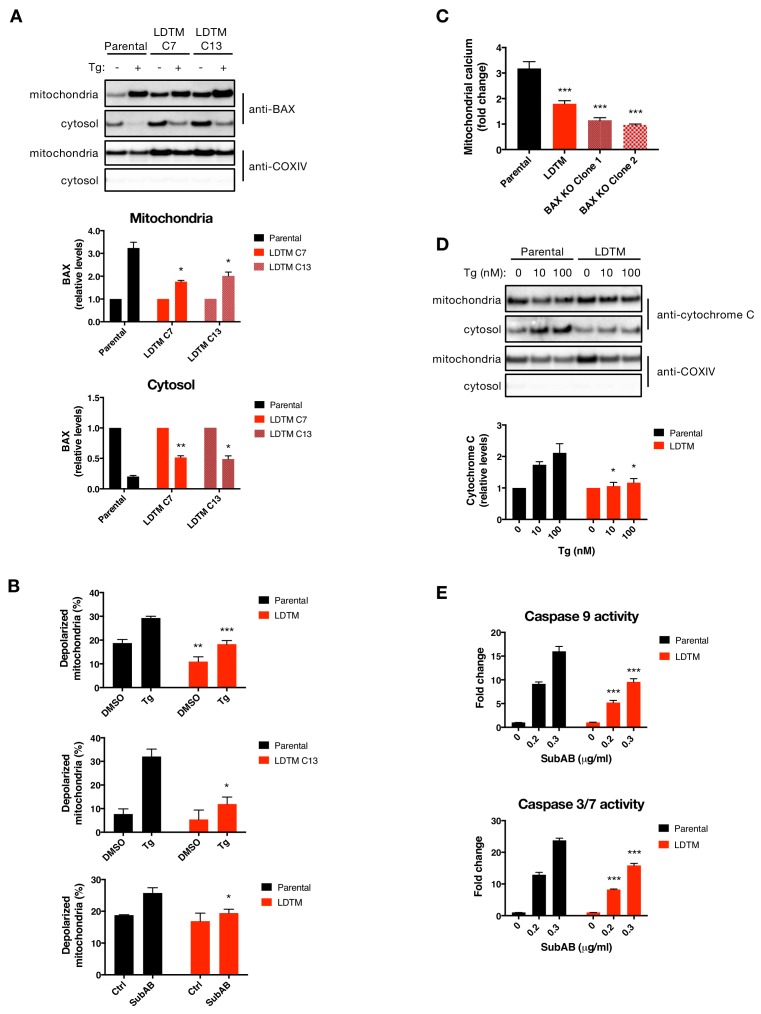
Figure 4. LDTM attenuates key mitochondrial apoptotic events.
(A) Parental KMS11 cells or two clones expressing ectopic LDTM (1-470) were treated with DMSO or 100 nM Tg for 20 hr. Cells were differentially lysed to enrich for mitochondrial or cytoplasmic fractions and equal amounts of protein were analyzed by WB (top). Mitochondrial BAX levels were quantitated by ImageJ relative to the mitochondrial marker COXIV; cytosolic levels were similarly quantitated and graphed in relation to the corresponding DMSO controls. Data represent mean ± SD from two independent experiments. (B) Parental KMS11 cells or LDTM overexpressing cells, either a pool (top panel) or clone 13 (middle panel) were treated with 100 nM Tg for 20 hr. Similarly, parental cells and the LDTM overexpressing pool were treated with 0.3 μg/ml SubAB for 3 hr (bottom). Cells were subsequently incubated with 2 μM JC-1 dye for 30 min and analyzed for mitochondrial depolarization by FACS based on a fluorescence emission shift from red (~590 nm) to green (~529 nm). The average percentage of cells exhibiting mitochondrial depolarization ± SD from two or more biological replicates is graphed. (C) Parental KMS11 cells, LDTM overexpressing cells or two cell lines harboring a BAX deletion were treated with 100 nM Tg for 24 hr. Cells were incubated with the mitochondrial calcium dye Rhod-2 and then analyzed by FACS. Data represent the mean fold change in fluorescence ± SD as compared to DMSO treated cells from three or more biological replicates. (D) Parental KMS11 cells or cells expressing ectopic LDTM (1-470) were treated with DMSO or 10 or 100 nM Tg for 20 hr and differentially lysed to enrich for mitochondrial or cytoplasmic protein. Equal amounts of protein were analyzed by WB (top) and cytosolic amounts of cytochrome C were quantitated by ImageJ and graphed relative to the corresponding DMSO controls (bottom). Bar graphs represent mean ± SD from two independent experiments. (E) Parental KMS11 cells or cells expressing ectopic LDTM (1-470) were treated with 0.2 or 0.3 μg/ml SubAB for 3 hr and analyzed by Caspase-Glo 9 (top) or Caspase-Glo 3/7 (bottom) assay. Graphs depict mean ± SD of three technical replicates.


