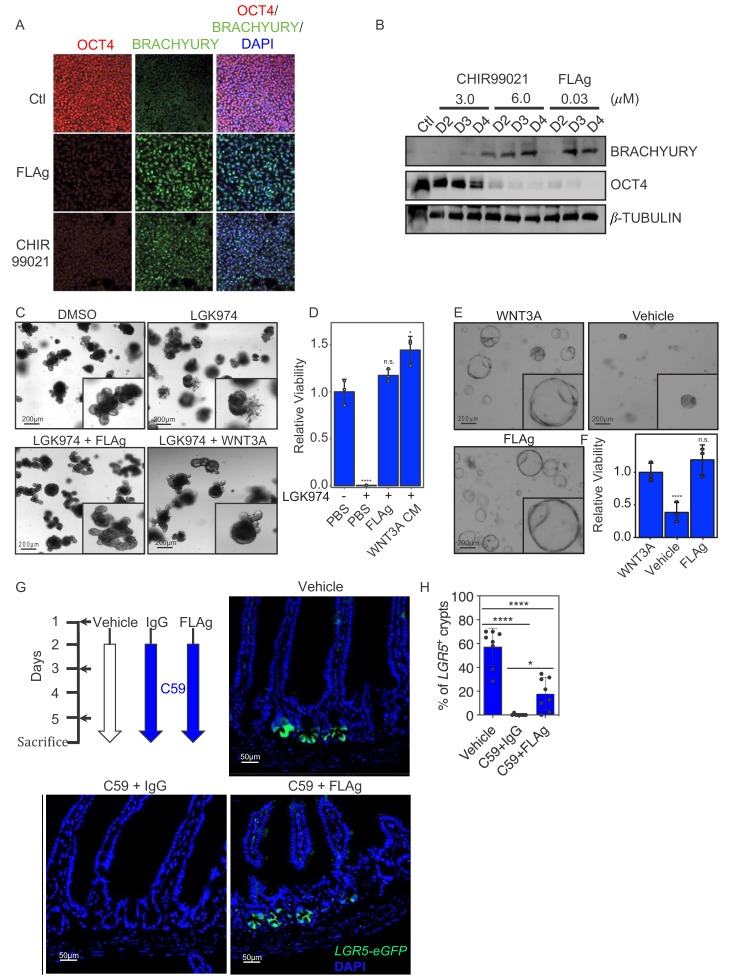
Figure 4. FLAg activity in cells, organoids and animals.
(A,B) Mesoderm differentiation of hPSCs induced by FLAg or the GSK3 inhibitor CHIR99021. Human PSCs were treated with 30 nM pan-FLAg (FP+P-L61+3) or with 3 or 6 μM CHIR99021 for the indicated times. Cells were fixed and visualized by immunofluorescence (A) or lyzed and analyzed by western blotting (B) to assess the levels of the pluripotency marker OCT4 and the early mesodermal lineage marker BRACHYURY. Immunofluorescence staining and western blots are representative of three and two independent experiments respectively. (C) Representative images of mouse small intestinal organoids with indicated treatments (1 μM LGK974, 1 μM LGK974 +30 nM pan-FLAg, 1 μM LGK974 +50% WNT3A conditioned media) (D) Viability of mouse small intestinal organoids following indicated treatments. Bars represent mean fold change ±s.d., representative of n = 3 independent experiments. Statistical analysis was performed by one-way ANOVA Dunnett’s test *p≤0.05, ****p≤0.0001. (E) Culture of human colon organoids with indicated treatments (10 nM pan-FLAg, control conditioned media or 50% WNT3A conditioned media). (F) Viability of human colon organoids following indicated treatments. Bars represent mean fold change ±s.d., representative of n = 3 independent experiments. Statistical analysis was performed by one-way ANOVA Dunnett’s test ****p≤0.0001. (G) Schematic of the in vivo workflow to evaluate FLAg efficacy. Vehicle (PBS), control IgG (10 mg/kg i.p) or FLAg (10 mg/kg i.p) groups were injected on day 1,3 and 5. The IgG and FLAg groups were further administered C59 (50 mg/kg, oral gavage) twice daily starting on day2. Representative fluorescence images of small intestinal sections from LGR5-GFP mice treated with Vehicle, IgG +C59 or pan-FLAg +C59. LGR5-GFP (green) is expressed in the stem cells at the bottom of crypts. Cell nuclei were counterstained with DAPI. (H) Quantification of LGR5 +crypts. Percentage of LGR5 +crypts was evaluated by counting at least 100 crypts per mouse in four different mice in two independent experiments (eight mice total per group). Statistics, one way ANOVA followed by Tukey test compared to vehicle treated group. *p<0.05, ****p<0.0001.

